Download
1 / 4
40 likes | 180 Vues
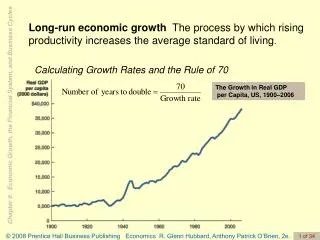
Table 9.2 Trend in Real GDP per Capita and Productivity (annual rates) Growth Growth in real GDP in output per capita per worker hour Year (%) (%) 1960–1973 2.9 3.1 1973–1995 1.9 1.6 1995–2000 2.6 2.2 2001-2003 0.9 3.9

E N D
Table 9.2 Trend in Real GDP per Capita and Productivity (annual rates) Growth Growth in real GDP in output per capita per worker hour Year (%) (%) 1960–1973 2.9 3.1 1973–1995 1.9 1.6 1995–2000 2.6 2.2 2001-2003 0.9 3.9 Source: Bureau of Economic Analysis and Census Bureau. Calculations are by the author.
Table 9.3 Average Annual Changes in GDP per Capita Change in real GDP per capita Year (%) 1950–1959 2.3 1960–1969 3.1 1970–1979 2.2 1980–1989 2.1 1990–1999 1.9 Entire Period: 1950-1999 2.3 Source: Bureau of Economic Analysis and Census Bureau. Calculations are by the author.