Download
1 / 11
110 likes | 267 Vues
Chapter 10 covers two-sample hypothesis testing, focusing on evaluating the difference between two independent population means, both with known and unknown standard deviations. It includes the use of F-tests to compare variances. Assumptions include independence of samples and normality or sufficient sample size. Detailed examples help illustrate how to form null and alternative hypotheses, calculate test statistics, and interpret confidence intervals. You will learn to analyze scenarios like the difference in mean calories between U.S.-made and foreign beers while ensuring valid assumptions about population variances.

E N D
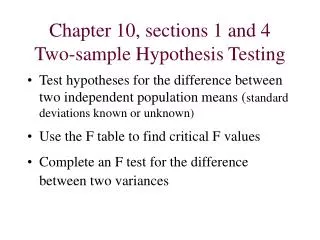
Chapter 10, sections 1 and 4Two-sample Hypothesis Testing • Test hypotheses for the difference between two independent population means (standard deviations known or unknown) • Use the F table to find critical F values • Complete an F test for the difference between two variances
Difference Between Two Means Goal: Test hypothesis or form a confidence interval for the difference between two population means, μ1 – μ2. Assumptions: • Different data sources-- populations are Unrelated and Independent • two samples are randomly and independently drawn from these populations. • Sample selected from one population has no effect on the sample selected from the other population • population distributions are normal or both sample sizes are 30
Possible Hypotheses Are: Upper-tail test: H0: μ1≤μ2 H1: μ1>μ2 i.e., H0: μ1 – μ2≤ 0 H1: μ1 – μ2> 0 Lower-tail test: H0: μ1μ2 H1: μ1 < μ2 i.e., H0: μ1 – μ2 0 H1: μ1 – μ2< 0 Two-tail test: H0: μ1 = μ2 H1: μ1≠μ2 i.e., H0: μ1 – μ2= 0 H1: μ1 – μ2≠ 0
Population standard deviations are known, σ1 and σ2 known, use Z test. • The test statistic for μ1 – μ2 , based on sample sample means, is: • The Confidence interval for μ1 – μ2 is:
σ1 and σ2 Unknown Assumptions: • Samples are randomly and independently drawn • Populations are normally distributed or both sample sizes are at least 30 • Population variances are unknown but assumed equal, σ1 and σ2 unknown, but known to be equal • The population variances are assumed equal, so use the two sample standard deviations and pool them to estimate σ • The test Statistic for μ1 – μ2 has a t distribution with a degree of freedom of (n1+n2-2):
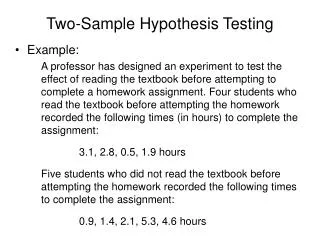
Where: • The confidence interval for μ1 – μ2 is: • Example: • Last week you were given a sample of 69 beer, 54 are U.S.-made and 15 are foreign-made. Additional information were provided with respect to price, calories, and percent alcohol content. • Let’s assume the two populations are unrelated, independent, and approximately normally distributed with equal variance • Assume that the two samples are independently drawn.
Questions: • Is there evidence of a difference in mean calories of us and non-U.S. beers? • What is the 95% confidence interval for the difference in mean calories? • Are conclusions in 1 and 2 consistent? • U.S. beers have about 10% more alcohol than non-U.S. beers. • Is the assumption of equal population variances, that you used for 1 and 4 a valid assumption? • Is there evidence that there is less variation in price of imported beers than price of domestic beers
Hypothesis Tests for Variances • Test of two population variances • Hypotheses: H0: σ12 / σ22=1 H1: σ12 / σ22≠1 H0: σ12 = σ22 H1: σ12 ≠ σ22 Two-tail test H0: σ12σ22 H1: σ12 < σ22 H0: σ12 / σ221 H1: σ12 / σ22 <1 Lower-tail test H0: σ12 ≤ σ22 H1: σ12 > σ22 H0: σ12 / σ22 ≤1 H1: σ12 / σ22 >1 Upper-tail test
The test statistic from samples is • F-Distribution can take values from 0 to infinity • It is a right-skewed distribution = Variance of Sample 1 n1 - 1 = numerator degrees of freedom = Variance of Sample 2 n2 - 1 = denominator degrees of freedom
Finding the critical lower and upper tail values • Find FU from the F table for n1 – 1 numerator and n2 – 1 denominator degrees of freedom • Find FL using the formula: • Where FU* is from the F table with n2 – 1 numerator and n1 – 1 denominator degrees of freedom (i.e., switch the d.f. from FU) H0: σ12 = σ22 H1: σ12 ≠ σ22 /2 /2 Do not reject H0 0 F FL FU