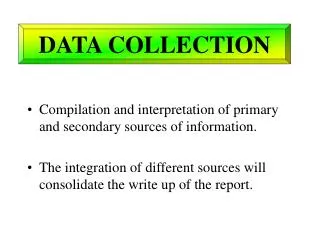
TRAFFIC DATA COLLECTION
TRAFFIC DATA COLLECTION. Prepared by:. KMF Traffic Group, LLC (MBE). www.kmftraffic.com. Karen Fiorillo , ESQ (NJ) Principal Operation Manager. Mario Fiorillo , SI Senior Project Manager Traffic Signal Inspector.

TRAFFIC DATA COLLECTION
E N D
Presentation Transcript
TRAFFIC DATA COLLECTION Prepared by: KMF Traffic Group, LLC(MBE) www.kmftraffic.com Karen Fiorillo, ESQ (NJ) Principal Operation Manager Mario Fiorillo, SI Senior Project Manager Traffic Signal Inspector We would like to thank Treasure and Space Coast Chapter of ITE for giving us the opportunity to provide the presentation on Traffic Data Collection. Working in the field of Transportation Engineering for over 25 years we certainly understand the importance of accurate data. A traffic study can only be as accurate as the data it is based on. Therefore special efforts should be made to insure that the collection and recording of traffic data is thorough and accurate.
TRAFFIC DATA COLLECTION Traffic data collection studies can help agencies and traffic engineers make sound traffic decisions about the operation of a particular intersection or link. The most common type of data collected for the purposes of traffic engineering are traffic volume, speed data and vehicle classification. Traffic volume studies are conducted to determine the number, movements, classifications of roadway vehicles at a given location. • This data also can help identify: • Critical flow time periods (PK HR) • Influence of large vehicles or pedestrians on vehicular traffic flow • Traffic volume trends. Engineers use this data to perform analysis of an intersection operation condition. (Level of Services) For sample of vehicle volume, speed and classification please visit our website at the end of the presentation
TRAFFIC VOLUME STUDIES ARE CONDUCTED TO DETERMINE: Vehicle Volume(All Traffic) Composition of Traffic(Classification) Geometric Design of Intersection or Roadway Sign and Signal Installation Signal Timing Traffic Circulation Patterns Capacity Analysis and many more
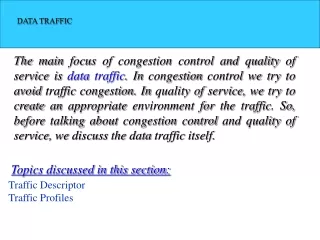
OTHER CLASSIFICATIONS So far most of the presentation is being tailored towards the most typical counts, traffic volume. Other counts such as vehicle classification may become important in highly industrial areas. Truck percentage however is used on a regular basis with most capacity calculations. Truck percentages can be collected at the same time as other vehicles count. A truck is typically classified as any vehicle with more than two axles. Further sub-categories can be collected as necessary for multi-axles vehicles.
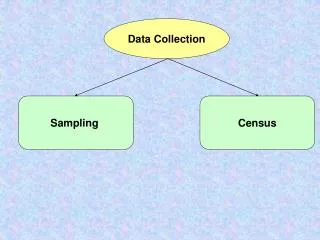
When to used Manual Count or Automatic Traffic Recorder ? Speaker comments at the presentation
MANUAL COUNTS METHOD Electronic Counting Board Tally Sheets Mechanical Counting Board Recording data onto tally sheets is the simplest means of conducting manual counts. The data can be recorded with a tick mark on a pre-prepared field form. A watch or stopwatch is necessary to measure the desired count intervals. Tally sheets are used for every 15 minutes of the count. Typical MCB are push button devices with three to five registers. A watch or a stopwatch is also necessary with this method to measure the desired count interval. The data is recorder every 15 minutes. When the interval is reached the observe reads the counter, records the data. Electronic counting boards are battery-operated, hand-held devices. They have an internal clock that automatically separates the data by time intervals. Special function include automatic data reduction and summary.
AUTOMATIC TRAFFIC RECORDER COUNT METHOD • Basic • The Power of Time-Stamped Data - In recording its data, the TRAX Flex HS time-stamps every axle recorded during the count. With this time-stamping, you can record one set of data and get traffic volume, speed,classification and gap data all from that one data set. What’s more, the time stamp data actually lets you fix problems after the data has been collected. • Volume Only • If you select Volume Only you only get volume. Automatic Traffic Recorder
AUTOMATIC COUNT METHOD Automatic Traffic Recorder • FHWA Type F Vehicle Classification Scheme • Class 1 - Motorcycles. • Class 2 - Passenger cars. • Class 3 - Pickups, Vans and other 2-axle, 4-tire single unit vehicles. • Class 4 - Buses. • Class 5 - Two-Axle, Six-Tire Single Unit Trucks. • Class 6 - Three-Axle Single Unit Trucks. • Class 7 - Four or More Axle Single Unit Trucks. • Class 8 - Four or Less Axle Single Trailer Trucks. • Class 9 - Five-Axle Single Trailer Trucks. • Class 10 - Six or More Axle Single Trailer Trucks. • Class 11 - Five or Less Axle Multi-Trailer Trucks. • Class 12 - Six-Axle Multi-Trailer Trucks. • Class 13 - Seven or More Axle Multi-Trailer Trucks.
Land Use Typical Peak Hour Residential Sample of counted periods. 4-6 PM weekday Shop. Cntr. Office School SAMPLE OF COUNTED PERIOD The length of the sampling period depends on the type of count being taken and the intended use of the data recorded. 7-9 AM and 4-6 PM weekday 7-9 AM and 4-6 PM weekday Varies based on school release times
COUNTED PERIOD Determining the appropriate count period is critical for traffic studies. The count period should represent the typical time of day, day of month, and month of year to be studied. It normally should avoid Mondays and Fridays (which may not represent typical weekday traffic), times of special events, or compromising weather conditions, unless, of course, the study is focusing on their effects on traffic volume. Typical count periods may depend on the type of nearby land uses. Many nearby land uses may influence peak times of a particular intersection.
OBSERVATION For example, we counted numerous intersections near a hospital and the peak hour was during a mid afternoon shift change rather than the typical pm peak hour. Schools, churches, hospitals or shipping centers may impact peak periods due to their individual peaking characteristics. Under unusual conditions when recreational traffic is significant or high shopping areas, traffic counts may need to be taken on weekends. Care should be given to understand the surrounding land uses before scheduling peak hour counts over a limited time period.
KMF Traffic Group Procedures Review TMC Project Request Telephone fax email others Review aerial photograph of project location, and visit site if needed. Select proper observer location. Determine the number of counters required. This is based on the intersection configuration, vehicle volume, number of double left turns, number of thru lanes, free flowing right lane and total visibility of the location being counted. Also if vehicle classification and/or pedestrians are counted. Provide a quote to the client based in our experience and site location. The quote contains when the count will be performed and the estimated day when the data will be summarized.
KMF Traffic Group Procedures (cont) • Perform Count beginning on time • Download Data (in office or via internet) • Evaluate data for accuracy. • Summarize data and prepare field report • Our summary includes: Location summary, field photos which includes a photograph of each approach to an intersection, lane configuration of all the approaches, posted speed limit and any field notes helpful to the engineer in performing any analysis of the intersection. Normally the location summary is provided in a PDF format. For sample of location summary, field photos and field notes please visit our website at the end of the presentation
SOME TRAFFIC ENGINEERING APPLICATIONS THAT GO HAND AND HAND WITH TRAFFIC DATA COLLECTION
This study involves the analysis of an existing intersection in order to develop a specific conceptual design recommendation. FDOT DATA REQUIRED FOR APPLICATION OF ENGINEERING STUDIES INTERSECTION ANALYSIS Fifteen-minute turning movement volumes shall be taken for a totalof eight hours encompassing the morning, midday peak and afternoon traffic periods and/or peak periods during which warranting volumes exist and an off-peak period. Each period shall normally consist of the eight (8) consecutive 15-minute intervals (2 hours) during each period that yields the highest total volume of vehicles entering the intersection.
SIGNAL WARRANT STUDYWarrant 1, Eight-Hour Vehicular Volume.Warrant 2, Four-Hour Vehicular Volume.Warrant 3, Peak Hour.Warrant 4, Pedestrian Volume.Warrant 5, School Crossing.Warrant 6, Coordinated Signal System.Warrant 7, Crash Experience.Warrant 8, Roadway Network.Road tube counts should be conducted first in order to determine, (1) the need for TMC’s (i.e., if the volumes are too low then 8 to 12 hours of TMC’s are not needed and the warrants may be completed based on the road tube counts only); and (2) the appropriate time periods for conducting TMC’s. FDOT DATA REQUIRED FOR APPLICATION OF ENGINEERING STUDIES
FDOT DATA REQUIRED FOR APPLICATION OF ENGINEERING STUDIES INTERSECTION DELAY STUDY: is used to evaluate the performance of intersections in allowing traffic to enter and pass through, or to enter and turn onto another route. This study will effectively provide a detailed evaluation of stopped time delay at the intersection. This study is generally used in conjunction with Warrant 2 (Interruption of Continuous Traffic) and Warrant 10 (Peak Hour Delay) and can be equally applicable in the evaluation of pedestrian delays at an intersection by substituting “pedestrian” for “vehicle” counts. VEHICLE GAP SIZE STUDY: is used to determine the size and the number of gaps in the vehicular traffic stream for pedestrian and school crossing studies. This study can also be used to determine the number of gaps available to side street traffic to enter the mainline traffic stream.
TRAVEL TIME AND DELAY STUDYTravel time and delay studies shall be conducted in each direction of travel during the morning and afternoon peak traffic periods as determined from 24-hour traffic counts, and also during a daytime off-peak period. The number of runs to be made for each direction and time shall be determined by the procedure in Chapter VIII of the FDOT Manual on Uniform Traffic Studies (MUTS). FDOT DATA REQUIRED FOR APPLICATION OF ENGINEERING STUDIES LEFT TURN PHASE WARRANTFifteen-minute turning movement volumes shall be taken for a total of 4 hours encompassing the peak traffic periods, during which warranting volumes exist. Each period shall normally consist of eight (8) consecutive 15-minute intervals (2-hours) during each period which yields the highest total volume of vehicles entering the intersection as determined from the 24-hour traffic counts.
ANY QUESTION ? KMF TRAFFIC GROUP List of services MANUAL COUNT TRAFFIC PEDESTRIAN CLASSIFICATION ATR’s VOLUME CLASSIFICATION SPEED GAP FIELD OBSERVATION SIGNAL INSPECTION GAP ANALYSIS INTERSECTION DELAY QUEUE ANALYSIS O-D STUDIES PARKING OCCUPANCY TRAVEL TIME CRASH DATA SUMMARY SATURATION FLOW VIDEO APPLICATIONS LICENSE PLATE SURVEY PROJECT WEBSITE OTHERS Thank you for your attention For additional information about us please visit our website at www.kmftraffic.com or call at (772) 221-7971 We look forward to assisting you with your traffic data needs For projects of three (3) intersections or less we will provide you with the report next day We will see you at the next ITE meeting