Download
1 / 24
280 likes | 553 Vues
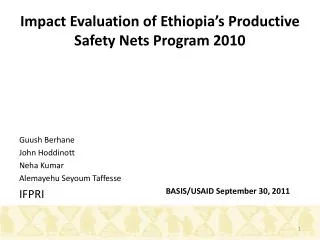
Impact Evaluation of Ethiopia’s Productive Safety Nets Program 2010. Guush Berhane John Hoddinott Neha Kumar Alemayehu Seyoum Taffesse IFPRI. BASIS/USAID September 30, 2011. Outline. Study Objectives About PSNP Impact Methodology Data Impact Results Average impact

E N D
Impact Evaluation of Ethiopia’s Productive Safety Nets Program 2010 Guush Berhane John Hoddinott Neha Kumar Alemayehu Seyoum Taffesse IFPRI BASIS/USAID September 30, 2011
Outline • Study Objectives • About PSNP • Impact Methodology • Data • Impact Results • Average impact • Regional Variation • Summary of other results • Future work
PSNP Evaluation 2010- Study Objectives • Document progress in the implementation of the PSNP and the HABP (Household Asset Building Program); • Assess trends in perceptions of the effectiveness and transparency of the PSNP and HABP among different groups of clients; • Assess progress towards graduation from the PSNP among different groups of PSNP clients; and • Measure the impact of the PSNP on the well-being of the chronically food insecure population; • Measure the complementary roles played by the PSNP and HABP in achieving positive outcomes for the food insecure. • Mixed methods were employed- the IFPRI team lead the quantitative analysis and the IDS team lead the qualitative analysis. • Geographical focus: highland areas: Tigray, Amhara, Oromiyaand SNNPR; lowland areas: Somali and Afar
PSNP • 1993-2004, GoE launched near annual emergency appeals for food aid. • These averted mass starvation • But did not alleviate threat of further famine • In 2005, the Food Security Program (FSP) was implemented by GoE and a consortium of donors as a new response to chronic food insecurity in rural Ethiopia. • Objectives of the FSP • Provide transfers to food insecure population in chronically food insecure woredas • Prevent asset depletion • Create community assets • Components of FSP we study: • PSNP -> Public works and Direct Support • HABP • No pilot. Implemented at scale. Currently covers about 7 million people.
Methodology for Evaluating the Impact of the PSNP (1) • Since PSNP was not implemented randomly • simple comparison of mean outcomes between beneficiary and non-beneficiary households will give a biased estimate of impact. • In earlier evaluations of the PSNP we address this bias • by constructing a comparison group for the evaluation by matching PW beneficiaries to households that did not take part in PW based on observable household and community characteristics. • The impact of PW is estimated as the (weighted average) difference in outcomes between PW beneficiaries and the matched sample of nonbeneficiaries.
Methodology for Evaluating the Impact of the PSNP (2) • These matching methods suffer from some limitations that have become increasingly important over time: • Rely on construction of a comparison group who, even though have comparable characteristics, do not receive PSNP benefits. • There has been considerable movement in and out of PSNP as a result the group that never received transfers is rather small • These households are observably different from PSNP beneficiaries- if they have never been deemed sufficiently food insecure in the six year period to warrant inclusion in the program
Methodology for Evaluating the Impact of the PSNP (3) • These matching methods suffer from three limitations that have become increasingly important over time (continued): • It has not been possible to estimate the impact of Direct Support transfers using matching methods. • There are not enough households that have characteristics similar to DS beneficiaries but do not receive any transfers from the PSNP (PW or DS) • With PSNP now in its sixth year of operation, there are now some households that have received transfers that run into 1000s of birr. • It would be useful to understand if there are diminishing, or increasing, impacts associated with higher levels of transfers. This is not possible with matching methods used in previous evaluations.
Methodology for Evaluating the Impact of the PSNP (4) • We employ an alternative approach which allows us to assess the impact of the level of transfers on outcomes of interest. • Level of transfers received is not random: households that receive high level of transfers may be very different from households that receive low level of transfers. • The “dose-response function” addresses this problem of comparability by adjusting for differences in household characteristics (such as head’s age, gender, education, household size and composition, household assets and variables that capture social position) between households receiving different levels of transfers.
Methodology for Evaluating the Impact of the PSNP (5) • Outcome measures presented today: • Change in food gap • where food gap is defined as the number of months in the last year a household was unable to fulfill its food needs. • Change in food gap= Food gap2010 - Food gap2006 • Change in Tropical Livestock Units held • TLU- method of quantifying a wide range of different types of livestock in a standardized manner. • Change in TLU= TLU2010 - TLU2006
Data • The first large-scale PSNP evaluation survey was fielded in 2006. Its design was based on discussions by relevant Government of Ethiopia actors (FSCB/FSCD, CSA) and donors with technical support from IFPRI. The sample is representative of chronically food insecure woredas at the regional level as of April 2006. • Regions covered- Tigray, Amhara, Oromiya and SNNPR • Panel of 3700 households surveyed in 2006, 2008 and 2010 • Survey timing across rounds have been comparable • Attrition is 2.5 percent per year; average by international standards for panel data collection. Attrition is basically random.
Some payment data issues • The 2006, 2008 and 2010 surveys give us payments data (cash and in-kind) for the following periods: • January - May 2006 • January 2007 – May 2008 • January 2009 – May 2010. • We value in-kind transfers at prevailing (local) market prices and add these values to cash payments received to generate the amount of total payments received over this period. • To account for inflation, we deflate transfers by regional Consumer Price Indices (CPI) so that all transfers are expressed in June 2006 Birr. • We limit the sample to households that have received PSNP payments for Public Works in at least two years between 2006 and 2010. This is appropriate given that the objective of the PSNP is to provide transfers to households on a multi-year basis.
Distribution of PW payments: January 2006 – May 2010(real 2006 Birr)
Dose-response function for Public Works transfers and changes in the food gap, 2006-2010
Predicted impacts by transfer level: Changes in food gap and TLU
Regional differences in impact of PW transfers on changes in the food gap
Regional differences in impact of PW transfers on changes in TLU
Accounting for these regional differences • Note the following results from the descriptive report
Accounting for these regional differences • Why low impact in Amhara and Oromiya? • Generally, transfer levels are lower • Payments are lumpy (see previous slide) • Payments are unpredictable • Long lags between work and payment • Short notice (typically one day) that payment is coming • Why difference between Tigray and SNNPR? • Possibly because of differences in transfer modality • Differences in the initial level of food insecurity. In 2006: • More than 30 percent of Tigrayan households had food gap > 4 months • Just under 10 percent of SNNPR households had food gap > 4 months • Recent discussions with officials in Tigray revealed that they advised against accumulating too many animals. Favored raising few but well. (Issues with over grazing)
Summary of Other impact Estimates:2006-2010 Comparing cash and in-kind transfers • In-kind transfers protected households from food insecurity more than cash transfers. At median transfer the food gap went down by 1.5 months • Cash transfers, but not in-kind transfers, helped accumulate livestock Comparing male and female headed household • At equivalent levels of transfers: • Asset accumulation is higher in male headed households • Reductions in food insecurity are greater in female headed households Impact of Direct Support • We have some evidence that Direct Support payments are reducing food insecurity Impact of PW payments + OFSP/HABP • OFSP/HABP + PW appears to have a larger effect on reducing the food gap than PW by itself
Summary of impacts:2006-2010 • For a “typical” beneficiary household (ie one receiving median transfers between 2006 and 2010), the impact of receiving PW transfers is to: • Reduce food insecurity by 0.9 months • Increase livestock holdings by the equivalent of one TLU • But these “typical” findings mask important heterogeneity in these data: • In SNNPR, PW PSNP leads to reduced food insecurity and increased asset holdings • In Tigray, PW PSNP leads to large reductions in food insecurity but little change in asset holdings • In Amhara and Oromiya, there is no impact on food insecurity and some impact on asset holdings
Future work… • Measure impact on more outcomes: • Consumption expenditures • Calorie availability • Agricultural productivity • Use of fertilizers and investment in water harvesting/soil conservation technologies • Anthropometric outcomes • Examine the average treatment effect of any PW transfers received (with/without treatment effect)