Download
1 / 53
540 likes | 806 Vues
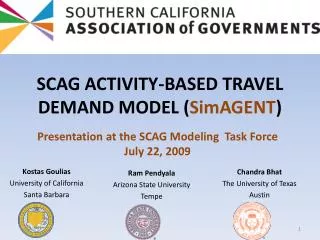
SCAG Regional Travel Demand Model 2003 Model Validation Summary Report. Presentation to Modeling Task Force January 24, 2007. Acknowledgement.

E N D
SCAG Regional Travel Demand Model 2003 Model Validation Summary Report Presentation to Modeling Task Force January 24, 2007
Acknowledgement The development of the new SCAG Regional Travel Demand Model would not be possible without significant contribution from MTF agencies and MTF Model Validation Working Group on this project and the basis of this model: • 2001 Post-Census Travel Survey • 2003 Regional Cordon Travel Survey • Various Transit and Rail On-Board Survey
Purpose • Brief Introduction to the new Regional Model • Year 2000 Model Calibration • Year 2003 Model Validation
New Model Highlights • Trip Based Convergence Model • Covers Entire SCAG Region • Integrated Highway and Transit Networks on GIS Geography • Developed on PC TransCAD Software • Updated Major Model Components • Calibrated to Year 2000 Travel Behavior • Validated to Year 2003 Travel Statistics
New SCAG Regional Model Boundary 6 Counties, 4 Air Basins 4109 Internal Zones 32 Ports and 12 Airport Nodes
SCAG Regional Modeling Process Households by Workers, Age, Size, Vehicles, Income Peak and Off-Peak Highway Networks Additional Zonal and Cost Data Household Classification Model TransitNetworks Truck Model Socioeconomic Data by Zone External Model Airport Trips Trip Assignment Model Time of Day Model Trip Distribution Model Mode ChoiceModel Vehicle Availability Model Trip Generation Model Work Logsums Home-Based Work Strategic Trips by 3 Income Groups Peak and Off -Peak Trip Tables by 10 trip purposes with 3 income groups for work trips Trip Ends by 10 trip purposes with 3 income groups for work trips Trip Tables by 5 Trip Purposes and 7 modes Households by Vehicles Available Intermediate StopModel Existing Models Legend Input Files Updated Models Data Output Files
2003 Socioeconomic Data Source: SCAG growth forecast
New Model Elements • Updated Components • Four-Step Model • Trip Generation • Detailed Socioeconomic Data • New Vehicle Availability Models • Household Classification Models • Trip Production and Attraction Models • Trip Distribution • Gamma Curves of Covariant Impedance • Intermediate Stops Model for HBWS • Mode Choice • New Mode Choice Models • Assignment • External Trips Model • Akcelik Volume Delay Functions
Trip Generation Model • Generate total person trips including non-motorized trips, stratified into14 trip types. • MNL vehicle availability model • Census household classification models • Cross-classification trip production models • Regression trip attraction models on household and NAICS employment data
Trip Generation Trip Types • Home Based Non-Work • Shopping • School (K-12) • College • Social/Recreational • Serving Passenger • Other • Home Based Work • Direct (by 3 income categories) • Strategic (by 3 income categories) • Non Home Based • Work-Other • Other-Other
Trip Production Calibration2000 Travel Survey and SCAG Model Total Trips * RSA data
Trip Attraction Calibration2000 Travel Survey and SCAG Model Total Trips * RSA data
Vehicle Availability Model Calibration2000 Census and SCAG Model at RSA level
Vehicle Availability Calibration2000 Census, 2000 Travel Survey, and SCAG Model
Trip Distribution • Calibrated friction factors by trip purpose, income group (for work trips), and time period (peak, off-peak), 28 curves in total. • Complex Gamma functions with covariant impedance • Logsum from mode choice used in home-based work direct trips • Intermediate stop choice models allocate home-based work strategic trips to intermediate stops after mode choice
Mode Choice Model • Nested Logit models • Separate models for each trip purpose, stratified by peak and off-peak periods • Include non-motorized trips • Model transit trips by mode and access/egress types
In-Vehicle Travel Time for Auto, Transit, Walk and Bike HOV time saved Distance Highway Terminal Times Transit Times Walk Access/Egress and Transfer Walk Time Transfer Wait Time(s) Transit Auto Access/Egress Time Parking Costs, Transit Fare, Auto Operating Costs per Household Income Group CBD Type Flag (Attraction Zone) Number of Autos per Person Peak Period Flag Mode Choice Utility Independent Variables
Mode Choice Model Nesting StructureWork, College, Shopping and Non-Home Trips Root Auto High Speed Rail Non-Motorized Dummy Dummy Dummy Dummy Dummy Commuter Rail DA SR2 SR3+ Walk Bike Dummy Dummy Dummy Dummy Transit Walk/Walk Walk/Auto Auto/Walk Auto/Auto Urban Rail Local Bus Express Bus UR Walk UR Auto LB Walk LB Auto EB Walk EB Auto
Root Auto Transit walk access Non-Motorized DA SR2 SR3+ Dummy Walk Bike Root Dummy Dummy Dummy DA Walk SR2 SR3+ Mode Choice Model Nesting StructureSchool and Strategic Trips • Home-based School Trips • Home-based Work Strategic Trips
Network Assignment • 4 time period equilibrium assignments • 3 auto classes (SOV, HOV2, HOV3+) • 3 classes of heavy duty trucks • External trips from external model • Ports trips from LA and LB ports • Airport trips from airport demand model • Simultaneous assignments with transit vehicles • Transit assignments by access mode
Screenline Directional Volume Scatter Plot R-square= 0.94