
Uploaded by
osborn
4 SLIDES
156 VUES
40LIKES
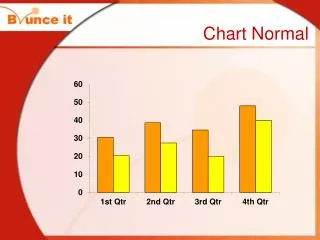
Visualizing Chart Overlap and Gap Width: A Comprehensive Guide
DESCRIPTION
This guide explores the concepts of chart overlap and gap width within data visualization. We examine how to set a gap width of 50 for clarity while analyzing the implications of -10 overlap and 75 overlap in chart representation. Understanding these parameters is crucial for effective data presentation, ensuring insights are communicated clearly through graphs. Dive into best practices for optimizing your charts, enhancing readability, and making data-driven decisions easier for your audience.
Download
1 / 4
Télécharger la présentation 
Visualizing Chart Overlap and Gap Width: A Comprehensive Guide
An Image/Link below is provided (as is) to download presentation
Download Policy: Content on the Website is provided to you AS IS for your information and personal use and may not be sold / licensed / shared on other websites without getting consent from its author.
Content is provided to you AS IS for your information and personal use only.
Download presentation by click this link.
While downloading, if for some reason you are not able to download a presentation, the publisher may have deleted the file from their server.
During download, if you can't get a presentation, the file might be deleted by the publisher.
E N D
Presentation Transcript


More Related