Download
1 / 23
230 likes | 344 Vues
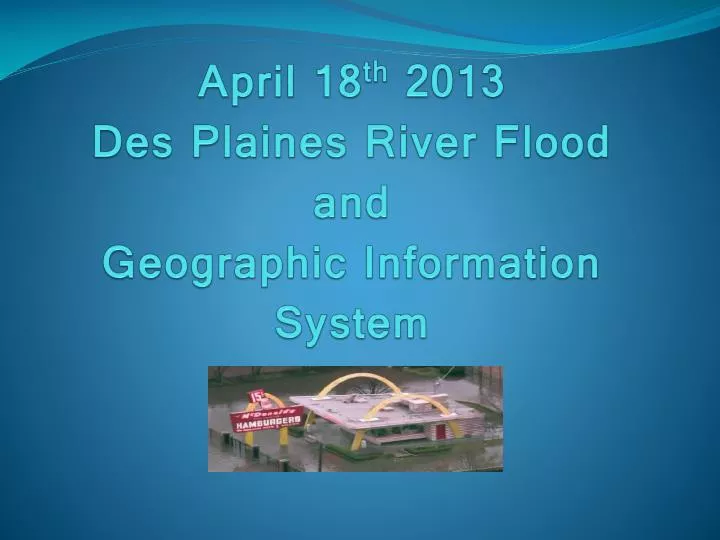
April 18 th 2013 Des Plaines River Flood and Geographic Information System. GIS in Emergency Operation Centers and Incident Command Posts.

E N D
April 18th 2013 Des Plaines River FloodandGeographic Information System
GIS in Emergency Operation Centers and Incident Command Posts This PowerPoint will illustrate how geographic information system (GIS) technology effectively improves workflow in the preparedness, response and recovery phases of emergency management and supports the Emergency Operation Center and the Incident Command Post(s).
The Incident Management GIS Team official mission is to integrate all necessary information to develop a common operational picture for EOC and ICP leadership, and other emergency responders. More specifically, the Team will collect, analyze, and disseminate information across all Emergency Management Support Functions under NIMS.
The GIS Consortium • The GIS Consortium (GISC) is a public entity consisting of local governments that work collectively to achieve the benefits of GIS and related technologies. • The City of Des Plaines is a member of the GIS Consortium.
Preparedness The GIS Role Prior to the April Flooding Projected flood stage maps existed in one foot increments starting at 6.0 feet and ending at the 11.0 foot stage.
The GIS Role During the April Flooding Created projected flood stage maps on the morning of the first day of the flood, for every half foot between stage 6.5 and stage 11.5, which was the predicted crest.
The GIS Role During the April Flooding Projected flood stage was determined using DTM elevation data compared to elevation of the Des Plaines River. A digital elevation model is a digital model or 3D representation of a terrain's surface — commonly for a planet (including Earth), moon, or asteroid — created from terrain
The GIS Role in the EOC/ICP These maps were hung in the EOC and placed in the ICP; they were utilized for strategic planning purposes. Des Plaines EOC Evacuation Incident Command Post in Deputy Fire Chief Trost buggy
The GIS Role and Public Information Road closures (showing date and time), sandbagging locations, and shelter locations were shown on the initial flood stage maps.
The GIS Role and Public Information These photos illustrate how GIS maps translate into field operations and PIO press releases to our residents and the general public.
The GIS Role During the April Flooding As the river receded and the flooding began to decrease, the projected flood stage maps began to show open routes. In additional, these maps were posted on the City’s website. Electronic message board locations notified residents about road closures, and roll-off dumpster locations placed to aid in the cleanup efforts.
Everbridge Notification • Everbridge, an emergency notification program (reverse 911) was used to make notifications to all residents within the projected flood stage. • GIS was used to determine the addresses that would be notified.
MapOffice Public Custom Overlay As the flooding progressed, and then receded, these flood stage maps formed the base for a custom overlay layer, created and utilized to notify the City’s residents of the following: • current water level • road closures (as of date and time) • sandbagging locations • roll off dumpsters • shelter location • electronic message boards • open routes • views in one week. Transparencies can be altered for easy viewing Data can be easily updated reflecting the most current information Residents have access to the most current information via a map link on the City’s website Over the course of the flood, this custom overlay received in excess of 14,000 views, far surpassing the average of approximately 100 per month.
Damage Assessment Maps for Community Development • The flood damaged areas were divided into three sections, and maps reflecting parcels in the floodway were highlighted. • City staff used these maps when going to facilitate their door-to-door assessments of the flood damage to these properties. • Their findings were then compiled and displayed on the maps. • Maps were updated every twelve hours.
RecoveryDamage Assessment Maps for FEMA • The City was broken down into eight areas and detailed maps showing the neighborhoods, buildings, and addresses were created. These maps were used by FEMA representatives as they went door-to-door to register the residents for federal aid. • FEMA provided the data to the City every afternoon and participated in a morning briefing the following day. Updated GIS and maps were produced showing impacted properties and distributed each morning to the FEMA Disaster Recovery Teams.
Plans for the Future • Use most sophisticated LiDAR data to recreate flood stages. This data is more accurate than the existing DTM that is currently being used. • Using this data, there are plans to predict which roads would be closed at what flood stage, and have public overlays available ahead of time instead of waiting for the notification that a road is closed and then updating manually. • Note: LIDAR, which stands for Light Detection and Ranging, is a remote sensing method that uses light in the form of a pulsed laser to measure ranges (variable distances) to the Earth. These light pulses—combined with other data recorded by the airborne system— generate precise, three-dimensional information about the shape of the Earth and its surface characteristics
Plans for the Future • Our next goal is to have the Incident Management GIS Team develop a GIS system for use by residents in boats so they can navigate the new water ways!
Conclusion • As the emergency management and GIS professions continues to be refined, the requirements to deal with complex issues across a variety of disciplines and stakeholders increase. • Disaster and preplanned events are increasing, populations are moving into more disaster-prone landscapes, and new threats exist. • Tomeet the demands, professional tools and technology are required. • GIS technology can serve a variety of purposes in supporting the workflows and mission of the emergency management profession. • Comprehensive emergency management requires coordination and collaboration among Incident Management Team and GIS personnel. • The use of GIS is improving how emergency management professionals carry out their work.
Contact Information MGP, Inc. 701 Lee Street, Suite 1020 Des Plaines, IL 60016 (847) 656-5698 info@mgpinc.com