Clustering Analysis of Differential Gene Expression in Drug Treatments and Hypoxia
150 likes | 264 Vues
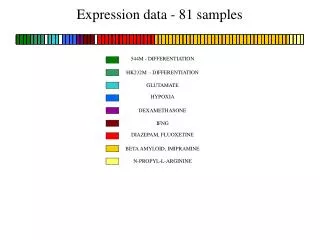
This study presents a clustering analysis of expression data from 81 samples, focusing on the effects of various drug treatments including Dexamethasone and Diazepam, and the impact of hypoxia on gene expression. Samples were organized based on expression correlation using the SPC method and clustered according to significant motifs from TransFac such as AP-2, USF, NF-Y, and NF-kappa B. The results illustrate patterns of activation and repression across different experimental conditions, highlighting sequence variations of similar motifs.

Clustering Analysis of Differential Gene Expression in Drug Treatments and Hypoxia
E N D
Presentation Transcript
544M - DIFFERENTIATION HK232M - DIFFERENTIATION GLUTAMATE HYPOXIA DEXAMETHASONE IFNG DIAZEPAM, FLUOXETINE BETA AMYLOID, IMIPRAMINE N-PROPYL-L-ARGININE Expression data - 81 samples
Clustering samples on expression and on motifs • The samples were clustered on expression correlation using the SPC method. This gave the following results: • This can be compared to arranging the samples on similar treatments, as shown before: • The samples were also clustered on significant motifs from TransFac: AP-2 USF NF-Y NF-kappa B
Significant sequences of length 4 - 7 • One iteration of REDUCE • Top 50 sequences for each sample • Red dots indicate activation • Green dots indicate repression • Motifs are clustered on the effect • Are sequences with similar effect variations of the same motif ?
Same picture as before, but on all sequences with significance > 0.001 • More sequences in the heatmap • Same structure as before