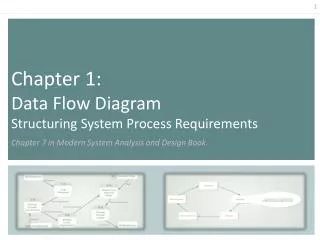
Chapter 7 Structuring System Process Requirements
Modern Systems Analysis and Design Fourth Edition. Chapter 7 Structuring System Process Requirements. Learning Objectives. Understand logical process modeling via data flow diagrams (DFDs). Draw DFDs of well structured process models. Decompose DFDs into lower-level diagrams.

Chapter 7 Structuring System Process Requirements
E N D
Presentation Transcript
Modern Systems Analysisand DesignFourth Edition Chapter 7 Structuring System Process Requirements
Learning Objectives • Understand logical process modeling via data flow diagrams (DFDs). • Draw DFDs of well structured process models. • Decompose DFDs into lower-level diagrams. • Balance high-level and low-level DFDs. • Explain differences between current physical, current logical, new physical, and new logical DFDs. • Use DFDs for analyzing information systems. • Explain use cases and use case diagrams.
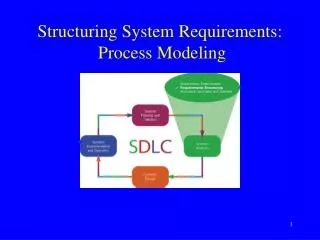
Process Modeling • A technique for graphically representing the processes that are used to capture, manipulate, store, and distribute data • between a system and its environment • among system components • Build a DFD using information gathered during requirements gathering and determination • Both processes and data structures are modeled in DFDs
Process Modeling (cont.) Deliverables and Outcomes • Context data flow diagram (DFD) • Shows the scope of a system (i.e., a top-level view) • Often DFDs are created showing the current physical and logical system • It enables analysts to understand how the current system operates • DFDs of new logical system • The DFD is independent of technology • It shows data flows, structure, and functional requirements of the new system • Includes a thorough description of each DFD component
Data Flow Diagram (DFD) • A picture of the movement of data between external entities and the processes and data stores within a system • How does a DFD differ from a systems flowchart? • DFDs depict logical data flow independent of technology • The focus is on data flows, not process flows alone
DFD Symbols (cont.) • Process: work or actions performed on data (inside the system) • Data store: data at rest (inside the system) • Source/sink: external entity that is origin or destination of data (outside the system) • Data flow: arrows depicting movement of data
DFD Diagramming RulesProcess No process can have only outputs or only inputs…processes must have both outputs and inputs. Process labels should be verb phrases.
All flows to or from a data store must move through a process. Data store labels should be noun phrases. DFD Diagramming RulesData Store
No data moves directly between external entities without going through a process. Interactions between external entities without intervening processes are outside the system and therefore not represented in the DFD. Source and sink labels should be noun phrases. DFD Diagramming RulesSource/Sink
DFD Diagramming RulesData Flow Bidirectional flow between process and data store is represented by two separate arrows. Forked data flow must refer to exact same data item (not different data items) from a common location to multiple destinations.
DFD Diagramming RulesData Flow (cont.) Joined data flow must refer to exact same data item (not different data items) from multiple sources to a common location. Data flow cannot go directly from a process to itself, must go through intervening processes.
DFD Diagramming RulesData Flow (cont.) • Data flow from a process to a data store means update (insert, delete or change). • Data flow from a data store to a process means retrieve or use • Data flow labels should be noun phrases.
Functional Decomposition • An iterative process of breaking a system description down into finer and finer detail • High-level processes described in terms of lower-level sub-processes • DFD charts created for each level of detail
DFD Levels • Context DFD • Overview of the organizational system • Level-0 DFD • Representation of system’s major processes at high level of abstraction • Level-1 DFD • Results from decomposition of Level 0 diagram • Level-n DFD • Results from decomposition of Level n-1 diagram
Context Diagram Context diagram shows the system boundaries, external entities that interact with the system, and major information flows between entities and the system. NOTE: only one process symbol, and no data stores shown.
Level-0 DFD Level-0 DFD shows the system’s major processes, data flows, and data stores at a high level of abstraction. Processes are labeled 1.0, 2.0, etc. These will be decomposed into more primitive (lower-level) DFDs.
Level-1 DFD Level-1 DFD shows the sub-processes of one of the processes in the Level-0 DFD. This is a Level-1 DFD for Process 4.0. Processes are labeled 4.1, 4.2, etc. These can be further decomposed in more primitive (lower-level) DFDs if necessary.
Level-n DFD Level-n DFD shows the sub-processes of one of the processes in the Level n-1 DFD. This is a Level-2 DFD for Process 4.3. Processes are labeled 4.3.1, 4.3.2, etc. If this is the lowest level of the hierarchy, it is called a primitive DFD.
DFD Balancing • The conservation of inputs and outputs to a data flow process when that process is decomposed to a lower level • Balanced means: • Number of inputs to lower level DFD equals number of inputs to associated process of higher-level DFD • Number of outputs to lower level DFD equals number of outputs to associated process of higher-level DFD
Unbalanced DFD This is unbalanced because the process of the context diagram has only one input but the Level-0 diagram has two inputs. 1 input 1 output 2 inputs 1 output
1 input 3 outputs Balanced DFD These are balanced because the numbers of inputs and outputs of context diagram process equal the number of inputs and outputs of Level-0 diagram.
Balanced DFD (cont.) These are balanced because the numbers of inputs and outputs to Process 1.0 of the Level-0 diagram equals the number of inputs and outputs to the Level-1 diagram. 1 input 4 outputs
Data Flow Splitting A composite data flow at a higher level may be split if different parts go to different processes in the lower level DFD. This remains balanced because the same data is involved, but split into two parts.
Four Different Types of DFD • Current Physical • Process labels identify technology (people or systems) used to process the data. • Data flows and data stores identify actual name of the physical media. • Current Logical • Physical aspects of system are removed as much as possible. • Current system is reduced to data and processes that transform them.
Four Different Types of DFD (cont.) • New Logical • Includes additional functions • Obsolete functions are removed • Inefficient data flows are reorganized • New Physical • Represents the physical implementation of the new system
Guidelines for Drawing DFDs • Completeness • DFD must include all components necessary for system. • Each component must be fully described in the project dictionary or CASE repository. • Consistency • The extent to which information contained on one level of a set of nested DFDs is also included on other levels.
Guidelines for Drawing DFDs • Timing • Time is not represented well on DFDs. • Best to draw DFDs as if the system has never started and will never stop. • Iterative Development • Analyst should expect to redraw diagram several times before reaching the closest approximation to the system being modeled.
Guidelines for Drawing DFDs • Primitive DFDs • Lowest logical level of decomposition • Decision has to be made when to stop decomposition
Guidelines for Drawing DFDs • Rules for stopping decomposition • When each process has been reduced to a single decision, calculation or database operation • When each data store represents data about a single entity • When the system user does not care to see any more detail
Guidelines for Drawing DFDs • Rules for stopping decomposition (continued) • When every data flow does not need to be split further to show that data are handled in various ways • When you believe that you have shown each business form or transaction, online display and report as a single data flow • When you believe that there is a separate process for each choice on all lowest-level menu options
Using DFDs as Analysis Tools • Gap Analysis • The process of discovering discrepancies between two or more sets of data flow diagrams or discrepancies within a single DFD • Inefficiencies in a system can often be identified through DFDs.
Using DFDs in Business Process Reengineering After: process 100 times as many transactions in the same time Before: Credit approval process required six days
Use Cases • Depiction of a system’s behavior or functionality under various conditions as the system responds to requests from users • Full functioning for a specific business purpose
<<include>> <<extend>> UML Use Case Diagram Symbols Use Case Actor Boundary Connection Include relationship Extend relationship
What is an Actor? • Actor is an external entity that interacts with the system. • Most actors represent user roles, but actors can also be external systems. • An actor is a role, not a specific user; one user may play many roles, and an actor may represent many users.
What is a Boundary? • A boundary is the dividing line between the system and its environment. • Use cases are within the boundary. • Actors are outside of the boundary.
What is a Connection? • A connection is an association between an actor and a use case. • Depicts a usage relationship • Connection does not indicate data flow
What is an <<extend>> Relationship? • A connection between two use cases • Extends a use case by adding new behavior or actions • Specialized use case extends the general use case
What is an <<include>> Relationship? • A connection between two use cases • Indicates a use case that is used (invoked) by another use case • Links to general purpose functions, used by many other use cases
Written Use Cases • Document containing detailed specifications for a use case • Contents can be written as simple text or in a specified format
Summary • In this chapter you learned how to: • Understand logical process modeling via data flow diagrams (DFDs). • Draw DFDs of well structured process models. • Decompose DFDs into lower-level diagrams. • Balance high-level and low-level DFDs. • Explain differences between current physical, current logical, new physical, and new logical DFDs. • Use DFDs for analyzing information systems. • Explain use cases and use case diagrams.