Download
1 / 31
320 likes | 725 Vues
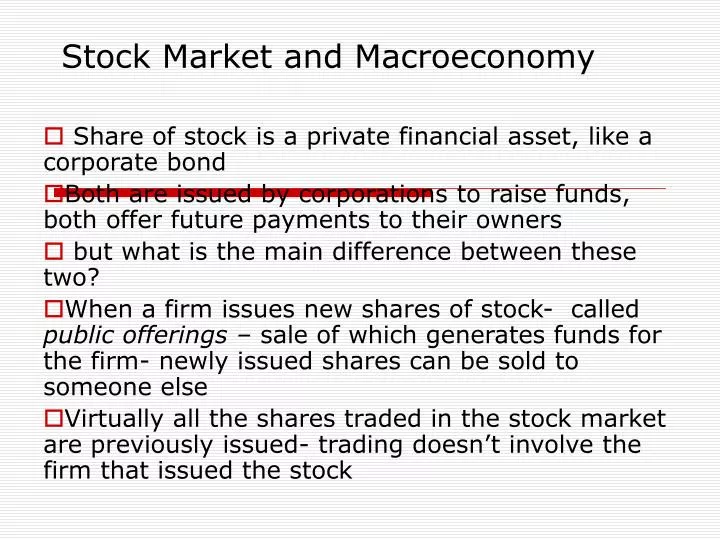
Stock Market and Macroeconomy Share of stock is a private financial asset, like a corporate bond Both are issued by corporations to raise funds, both offer future payments to their owners but what is the main difference between these two?

E N D
Stock Market and Macroeconomy Share of stock is a private financial asset, like a corporate bond Both are issued by corporations to raise funds, both offer future payments to their owners but what is the main difference between these two? When a firm issues new shares of stock- called public offerings – sale of which generates funds for the firm- newly issued shares can be sold to someone else Virtually all the shares traded in the stock market are previously issued- trading doesn’t involve the firm that issued the stock
Contd • But why the firm still concerned about the price of its previously issued share? - first, the firm’s owners-its stockholders-want high share prices because that is the price they can sell at -second, previously issued shares are perfect substitute of new public offerings – ------------therefore, the firm cannot expect to receive higher price for its new shares than the going price on its old shared ---what is the result then??
Contd.. • In 1983, only 19 percents of Americans owned share of stocks either directly or through mutual funds(?) – in 2003, almost 50% American owned stock • You own a share of stock implies you own part of the corporation-own a fraction of the company’s total stock • you are entitled to a particular percent of the firm’s after tax profit • However, firms do not pay all their after-tax profit to share holders- some is kept as retained earnings for later use of the firm • The part of profit distributed to share holders is called dividends • Aside from dividends, usually more important reason to holding stocks is to enjoy capital gains – return someone gets when they sell a stock at a higher price than they paid for it
Tracking the stock market • Financial market is so important that stocks and bonds are monitored on a continuous basis • You can find out the value of a stock instantly just by checking with a broker or logging onto a website • Daily news paper or specialized financial publication such as Wall Street Journal or Financial Times report daily information • In addition to that, there are many stock market indices
Tracking.. • Oldest and most popular average • Dow Jones Industrial Average (DJIA)-tracks prices of 30 of the largest companies • Another popular average • Broader Standard & Poor’s 500 (S&P 500) • NASDAQ index tracks share prices of about 5,000 mostly newer companies whose shares are traded on NASDAQ stock exchange • Often, stock market averages will rise and fall at the same time, sometimes by the same percentage • In spite of falling stock prices in 2000 and 2001, the last decade was good for stocks
Explaining Stock Prices—Step #1: Characterize The Market • Price of a share of stock—like any other— is determined in a market • We’ll characterize the market for a company’s shares as perfectly competitive • View stock market as a collection of individual, perfectly competitive markets for particular corporations’ shares • Many buyers and sellers • Virtually free entry
Step #2: Find The Equilibrium • Like all prices in competitive markets, stock prices are determined by supply and demand • However, in stock markets, supply and demand curves require careful interpretations • Figure 1 presents a supply and demand diagram for shares of Fedex Corporation • On any given day, number of Fedex shares in existence is just the number that the firm has issued previously • Just because 302 million shares of Fedex stock exist, that does not mean that this is the number of shares that people will want to hold • People have different expectations about firm’s future profits • At any price other than $90 per share, number of shares people are holding (on the supply curve) will differ from number they want to hold (on the demand curve) • Only at equilibrium price of $90— people satisfied holding number of shares they are actually holding • Stocks achieve their equilibrium prices almost instantly
Figure 1: The Market For Shares of Fedex Corporation S Price per Share $120 E 90 60 D Number of Shares 302 million
Step #3: What Happens When Things Change? • Supply curve for a corporation’s shares shifts rightward whenever there is a public offering • The changes we observe in a stock’s price—over a few minutes, a few days, or a few years—are virtually always caused by shifts in demand curve • what causes these sudden changes in demand for a share of stock? • In almost all cases, it is one or more of the following three factors • Changes in expected future profits of firm • Any new information that increases expectations of firms’ future profits will shift demand curves of affected stocks rightward • Including announcements of new scientific discoveries, business developments, or changes in government policy • Macroeconomic Fluctuations • Any news that suggests economy will enter an expansion, or that an expansion will continue, will shift demand curves for most stocks rightward • Changes in the interest rate • A rise (drop) in the interest rate in the economy will shift the demand curves for most stocks to the left (right)
Step #3: What Happens When Things Change? • Even expectations of a future interest rate change can shift demand curves for stocks • Such an event occurred on February 27, 2002, when Fed Chair Greenspan announced that it appeared economy was recovering from its recession • News that causes people to anticipate a rise in interest rate will shift demand curves for stocks leftward • Similarly, news that suggests a future drop in the interest rate will shift demand curves for stocks rightward
The demand curve shifts rightward when new information causes expectations of: • higher future profits • economic expansion • lower interest rates Figure 2a: Shifts in the Demand for Shares Curve (a) S Price per Share $75 60 D2 D1 Number of Shares 298 million
The demand curve shifts leftward when new information causes expectations of: • lower future profits • recession • higher interest rates Figure 2b: Shifts in the Demand for Shares Curve (b) S Price per Share 60 45 D1 D3 Number of Shares 298 million
Stock Market Macroeconomy Figure 3: The Two-Way Relationship Between The Stock Market and the Economy
How the Stock Market Affects the Economy • On October 19, 1987, there was a dramatic drop in the stock market • One that made decline on September 17, 2001 seem small by comparison • Dow Jones Industrial Average fell by 508 points—a drop of 23%— about $500 billion in household wealth disappeared • Newscaster Sam Donaldson asked, “Mr. President, are you concerned about the drop in the Dow?” • As Reagan entered his helicopter, he smiled calmly and replied, • “Why, no, Sam. I don’t own any stocks” • It was a curious exchange (perhaps Reagan was joking) • Whatever Reagan’s intent, statement was startling • Because, in fact, stock market does matter to all Americans
The Wealth Effect • To understand how market affects economy, let’s run through following mental experiment • Suppose that, for some reason stock prices rise • When stock prices rise, so does household wealth • What do households do when their wealth increases? • Typically, they increase their spending • Link between stock prices and consumer spending is an important one, so economists have given it a name • Wealth effect • Tells us that autonomous consumption spending tends to move in same direction as stock prices • When stock prices rise (fall), autonomous consumption spending rises (falls)
The Wealth Effect and Equilibrium GDP • Autonomous consumption is a component of total spending • Can summarize logic of the wealth effect • Changes in stock prices—through the wealth effect—cause both equilibrium GDP and price level to move in same direction • An increase in stock prices will raise equilibrium GDP and price level • While a decrease in stock prices will decrease both equilibrium GDP and price level
The Wealth Effect and Equilibrium GDP • How important is wealth effect? • Economic research shows that marginal propensity to consume out of wealth is between 0.03 and 0.05 • Change in consumption spending for each one-dollar rise in wealth • As a rule of thumb, a 100-point rise in DJIA—which generally means a rise in stock prices in general—causes household wealth to rise by about $100 billion • This rise in household wealth will increase autonomous consumption spending by between $3 billion and $5 billion—we’ll say $4 billion • Rapid increases in stock prices can cause significant positive demand shocks to economy, shocks that policy makers cannot ignore • Similarly, rapid decreases in stock prices can cause significant negative demand shocks to economy, which would be a major concern for policy makers
Figure 4: The Effect of Higher Stock Prices on the Economy (a) (b) AS Price Level AEhigher stock prices AElower stock prices Aggregate Expenditure P2 P1 ADhigher stock prices ADlower stock prices 45° Real GDP Real GDP Y1 Y3 Y2 Y1 Y2
How the Economy Affects the Stock Market • Let’s look at the other side of the two-way relationship • How economy affects stock prices • Many different types of changes in the overall economy can affect the stock market • Let’s start by looking at the typical expansion • Real GDP rises rapidly over several years • In typical expansion (recession), higher (lower) profits and stockholder optimism (pessimism) cause stock prices to rise (fall)
What Happens When Things Change? • Figure 5 illustrates three different types of changes we might explore • A change might have most of its initial impact on the overall economy, rather than the stock market • There might be a shock that initially affects stock market • Shock could have powerful, initial impacts on both stock market and overall economy
Shock to stock market Shock to macroeconomy Stock Market Macroeconomy Shock to both stock market and macroeconomy Figure 5: Three Types of Shocks
A Shock to the Economy • Imagine that new legislation greatly increases government purchases • To equip public schools with more sophisticated telecommunications equipment, or to increase the strength of our armed forces • What will happen? • Rise in government purchases will first increase real GDP through expenditure multiplier • When we include effects of stock market, expenditure multiplier is larger • An increase in spending that increases real GDP will also cause stock prices to rise, causing still greater increases in real GDP • Similarly, a decrease in spending that causes real GDP to fall will also cause stock prices to fall, causing still greater decreases in real GDP • This is one reason why stock prices are so carefully watched by policy makers, and matter for everyone • Whether they own stocks themselves or not
A Shock To the Economy and the Stock Market: The High-Tech Boom of the 1990s • 1990s—especially second half—saw dramatic rise in stock prices • Growth in real GDP averaged 4.2% annually from 1995-2000 • In part, economic expansion and rise in stock prices were reinforcing • Each contributed to the other • Internet had a direct impact on stock market through its effect on expected future profits of U.S. firms • At the same time, technological revolution was having a huge impact on overall economy
A Shock To the Economy and the Stock Market: The High-Tech Boom of the 1990s • Faced with these demand shocks, Federal Reserve would ordinarily have raised its interest rate target to prevent real GDP from exceeding potential output • Technological changes of 1990s were an example of a shock to both stock market and economy • Result was a market and an economy that were feeding on each other, sending both to new performance heights • Was this a good thing? • Yes, and no • In spite of all this good news, there were dark clouds on horizon
A Shock to the Economy and the Stock Market: The High-Tech Bust of 2000 and 2001 • The market—especially high-tech NASDAQ stocks—began to decline in early 2000 • Both economy and market were being affected by several events discussed in earlier chapters of this book • During 1990s, there had been an investment boom • Businesses rushed to incorporate the internet into factories, offices, and their business practices in general • Fed may have played a role as well • Decline in investment—and the recession it caused—can be regarded as a shock to economy • In addition, there was a direct shock to market • A change in expectations about the future • Unfortunately, in late 2000 and early 2001, reality set in
The Fed and the Stock Market • Experience of late 1990s and early 2000s raised some important questions about relationship between Federal Reserve and stock market • In 1995 and 1996, Greenspan and other Fed officials began to worry that share prices were rising out of proportion to the future profits they would be able to deliver to their owners • In this view, market in late 1990s resembled stock market in 1920s, which is also often considered a bubble
The Fed and the Stock Market • In 1996, when Alan Greenspan first made his “irrational exuberance” speech, he seemed to side with those who believed that the stock market was in midst of a speculative bubble • Fed would be forced to intervene to prevent wealth effect—this time in a negative direction—from creating a recession • Could Fed do so? • Probably • In mid-1990s, Greenspan seemed to be trying to “talk the market down” by letting stockholders know that he thought share prices were too high • Implied threat • If stocks rose any higher, Fed would raise interest rates and bring them down • It didn’t work
The Fed and the Stock Market • Not only were Greenspan’s efforts to “talk the market down” unsuccessful, they were also widely criticized • Greenspan seemed to change his tune as 1990s continued • By 1998, he had stopped referring to exuberance—rational or irrational • As 1990s came to a close, and the stock market continued to soar, Fed faced a new problem • Wealth effect • Figure 6 shows one way we can view Fed’s problem • With aggregate demand and supply curves • Figure 6 is useful, but it has a serious limitation • Doesn’t take account of the rise in potential output • But the Phillips curve can illustrate Fed’s goal more easily • To keep inflation low and stable without needing corrective recessions, Fed strives to maintain unemployment at its natural rate
If output exceeds potential, the self-correcting mechanism will raise the price level further Wealth effect of rising stock prices shifts ADrightward, raising realGDP and the price level Figure 6: The Fed’s Problem In 2000: An AS-AD View (a) (b) AS2 Price Level Price Level AS1 AS C P3 B P2 B P2 A AD2 AD2 A P1 P1 AD1 AD1 Real GDP Real GDP Y1 Y2 Y1 Y2
But if the natural rate is above 4% the Phillips curve will shift upward and the Fed must choose between higher inflation . . . If the natural rate of unemployment is 4%, the Fed can keep the economy at point Ain the long run . . . or recession Figure 7: The Fed’s Problem in 2000: A Phillips Curve View (a) (b) Inflation Rate Inflation Rate C 5.0% A D A 2.5% 2.5% B 1.5% PC1 PC1 PC2 Unemployment Rate Unemployment Rate 4% 4% 5% UN? UN?
The Fed and the Stock Market • Might think Fed can estimate natural rate by a process of trial and error • Bring unemployment rate to a certain level (such as 4%) and see what happens to inflation • Unfortunately, things are not so simple • Fed looks ahead and determines whether current economic conditions are likely to raise inflation rate in the future • That is just what Fed did beginning in mid-1999 • By raising interest rates to rein in the economy, Fed also brought down stock prices • By slowing economic growth and growth in profits • Through direct effect of higher interest rates on stocks • By 2001, high-tech bust, recession of 2001, and attacks of September 11 brought criticism to an end • As the economy began a slow expansion, in 2002 and early 2003, Fed kept the interest rate low • Unresolved question will surface again • Who should be setting the general level of share prices—millions of stockholders who buy and sell shares, or Federal Reserve?