Download
1 / 26
260 likes | 452 Vues
The Impact of ENSO on NAO Variability. Zhaohua Wu, B. P. Kirtman, E. K. Schneider Center for Ocean-Land-Atmosphere Studies and N. E. Huang Goddard Space Flight Center, NASA. OUTLINE. A question A natural filter based on EMD ENSO and NAO in observation Mechanism (incomplete) Summary.

E N D
The Impact of ENSO on NAO Variability Zhaohua Wu, B. P. Kirtman, E. K. Schneider Center for Ocean-Land-Atmosphere Studies and N. E. Huang Goddard Space Flight Center, NASA
OUTLINE • A question • A natural filter based on EMD • ENSO and NAO in observation • Mechanism (incomplete) • Summary
AN OLD STORY “Editorial Note: In the following suite of formal comments and responses we are following unusualprocedure; we are providing a venue for a valuable but unusual scientific exchange that involves multiple articles.” BAMS, 1999, p2721 • Wunsch, BAMS, 1999, p245-255. • Comments on “1” by Trenberth and Hurrell • Reply to “2” by Wunsch • Comments on “2” by Rajagoplan, Lall, and Cane • Reply to “4” by Trenberth and Hurrell
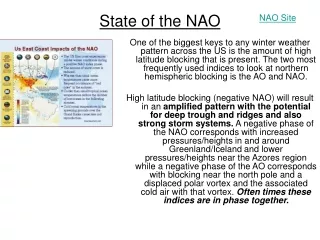
A QUESTION NAO Index X(t) = S(t) + N(t) Does white noise like NAO index contains the signals related to the interannual ENSO variability? (The lag one autocorrelation for the observed NAO index is 0.08.)
BAND PASS FILTERING • Traditional Filters • Subjective parameters • “local” -> “global” • Results • Tuned • fuzzy
signal source 1 signal source 2 signal source 3 signalsource 4 signal source 5 EMPIRICAL MODE DECOMPOSITION receiver
BAND PASS FILTER • EMD Filter • Adaptive without prescribed parameter • “local” ->”local” • Physical • Results • Clear • Dyadic
AN IDEALIZED MODEL • NAO = Internal Variability + ENSO forced signal • For simplicity, assuming • When the standard deviation of the noise is one, A is 0.4, T is about 4.2 yr.
APPROACHES • GCM Studies: Globally coupled vs. regionally uncoupled • In the regional uncoupled cases, the atmospheric model is forced by climatological SST while the ocean model is driven by the interactive fluxes.
WAVE CHAIN ROUTE • NAO and SST variability in the North Atlantic will still have a significant simultaneous (or slightly delayed) correlation with ENSO cycle if the causal effect is through PNA type of wave chains in the North Atlantic uncoupled case.
LOW LATITUDE ROUTE • If the ENSO effect is through the low latitude route by affecting the wind stress that drives the subtropical gyre, the correlation between ENSO and NAO will be missing.
GCMS & EXPERIMENTS • COLA Anomaly Coupled GCM: • ATMOSPHERE: COLA AGCM version 2, T42, 18 layers • OCEAN: GFDL MOM 2, 1.5˚*0.5˚ in the tropics, 1.5˚*1.5˚ in the high latitude, 25 layers (15 layers in upper 250 m) • ICE: observed climatology • EXPERIMENTS: • CONTROL: coupled globally • PAC_UNCOUPLED: Tropical Pacific (between 30˚N and 30˚ S) uncoupled • ATL_UNCOUPLED: North Atlantic (north of 15˚N) uncoupled • Additional
STORY TO BE CONTINUE • … • … • … • …
CONCLUSIONS • The new natural filtering method provides a unique opportunity to examine the impact of ENSO on NAO variability on interannual timescale • The observational evidence showed that NAO interannual variability is well correlated to ENSO variability in the tropical Pacific • The modeling studies demonstrate that the relation of ENSO and NAO is hidden in the seemingly white noise like NAO variability • More analysis need to be carried out to figure out causal relationships between ENSO and NAO