Download
1 / 15
150 likes | 334 Vues
James D. McCalley Harpole Professor of Electrical & Computer Engineering Iowa State University. Impact of Variability on Control Performance Metrics. Wind penetration is small now, so NERC says decreasing freq gov charac β not due to wind ,

E N D
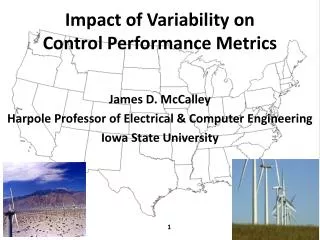
James D. McCalley Harpole Professor of Electrical & Computer Engineering Iowa State University Impact of Variability on Control Performance Metrics
Wind penetration is small now, so NERC says • decreasing freq gov charac β not due to wind, • Source: “Comments Of The North American Electric Reliability Corporation Following September 23 Frequency Response Technical Conference,” Oct. 14, 2010 • but…at higher wind penetrations, • β will decrease if non-wind units with primary control are displaced by wind units without primary control; • Reduced inertia and increased net load variability will cause greater frequency excursions. • Will higher wind penetrations degrade freq perf in terms of NERC’s Control performance metrics? Impact of variability on control performance • Each Balancing Authority shall achieve, as a minimum, • Requirement 1: CPS1 compliance of 100% • Requirement 2: CPS2 compliance of 90% • Potential requirements: BAAL and others….
Control performance standards Control Performance Standards CPS1 and CPS2 evolved from earlier metrics and were enacted by NERC in 1997 to evaluate a balancing area’s frequency control performance in normal interconnected power system operations. The motivation underlying CPS is to ensure a targeted long term frequency control performance of the entire interconnection. CPS measures each balancing area’s frequency control performance in achieving control objectives. N.Jaleeli and ,L.VanSlyck, “Control performance standards and procedures for interconnected operation,” Electric Power Research Institute, Dublin, Ohio, Tech.Rep. TR-107813, Apr.1997. N.Jaleeli and L.S.Vanslyk, “NERC’s new control performance standards. IEEE Trans. Power Syst.,” vol.14, pp.1092-1099, Aug.1999.
Control performance standards CPS1 CPS2 NERC Standard BAL-001-0.1a — “Real power balancing control performance,” http://www.nerc.com/files/BAL-001-0_1a.pdf.
CPS1:a measure of a balancing area’s long term (12 mo) frequency performance. • Control objective - bound excursions of 1-minute average frequency error over 12 months in the interconnection. • Measures control performance by comparing how well a balancing area’s ACE performs in conjunction with the frequency error of the interconnection. Ref: M. Terbrueggen, “Control Performance Standards” 2002 Average ACE, ΔF over 1 min to compute: 10B to give units of Hz. ΔF is an interconnection measure. ΔPtie is a balancing area measure. When ΔF<0, the interconnection needs generation, so desire BA to make ΔPtie large ACE>0 (helping). If ACE<0, it means BA is undergenerating “hurting.” So we want to see CP negative, large in mag.
CPS1:a measure of a balancing area’s long term (12 mo) frequency performance. • Control objective - bound excursions of 1-minute average frequency error over 12 months in the interconnection. • Measures control performance by comparing how well a balancing area’s ACE performs in conjunction with the frequency error of the interconnection. Ref: M. Terbrueggen, “Control Performance Standards” 2002 Average ACE, ΔF over 1 min to compute: Average CP 1min over 12 mo to compute: ε1 =target bound for 12 month of 1min avg freq error. e.g., 0.018Hz in EI, 0.228Hz in WECC, 0.020 Hz for ERCOT. Must be squared to normalize Hz2 in numerator.
CPS1:a measure of a balancing area’s long term (12 mo) frequency performance. • Control objective - bound excursions of 1-minute average frequency error over 12 months in the interconnection. • Measures control performance by comparing how well a balancing area’s ACE performs in conjunction with the frequency error of the interconnection. Ref: M. Terbrueggen, “Control Performance Standards” 2002 Average ACE, ΔF over 1 min to compute: Average CP 1min over 12 mo to compute: Problem: balancing area can grossly over- or under-generate (as long as it is opposite frequency error) and get very good CPS1, yet impact its neighbors with excessive flows (large ACEPtie,a>>Ptie,s).
CPS2: measure of a balancing area’s ACE over all 10-minute periods in a month. • Control objective – limit ACE variations & bound unscheduled power flows between balancing areas. • Developed to address “problem” of previous slide. Requirement: |ACE10min |< CPS2=100%-(Percent of 10 min periods in violation)>90% • L10 is max value within which ACE10min must be controlled • BS=sum of B values for all control areas. • ε10 =target bound for 12 mo RMS of10-min avg freq error: e.g., 0.0057Hz in EI, 0.0073 for the WI and ERCOT. • In 2003, the 10Bs were ~ -5692 mw/0.1hz for EI, -1825 mw/0.1hz for WEEC, -920 mw/0.1Hz for ERCOT.
Simulation System • Two Area System (Area A and Area B) • Wind power is assumed in area A • Each area consists of 10 conventional units, with inertia and with speed governing • Based points are computed from net load forecast made 7.5 min ahead, with an assumed error of 1% for load and 4.5% for wind. • Wind penetration levels- 6%, 10%, 13%, 17%, 21%, 25% (Pw/Pnw) are considered (by capacity). • Wind is assumed to displace conventional units • Actual sec-by-sec p.u. value of load and of wind power data from one wind farm is used. Con units A B Con units Wind units C. Wang and J. McCalley, “Impact of Wind Power on Control Performance Standards,” under review, IEEE Trans on Pwr Sys.
2 Area Simulation System C. Wang and J. McCalley, “Impact of Wind Power on Control Performance Standards,” under review, IEEE Trans on Pwr Sys.
Inputs for 2 Area Simulation System Area 2 input Area 1 input The sec-by-sec generation levels in each case (PG1,RTED and PG2,RTED) are determined by linearly interpolating between their respective 5 minute load and wind forecasts. C. Wang and J. McCalley, “Impact of Wind Power on Control Performance Standards,” under review, IEEE Trans on Pwr Sys.
Study results Case A: Area 1, Area 2 have same size. Case B: Area 1 unchanged. Area 2 load and gen scaled up by 10. Normalized CPS1 Conclusions: CPS1 and CPS2 deteriorates with increasing wind penetration. The effect is larger for “smaller” interconnections. Normalized CPS2 C. Wang and J. McCalley, “Impact of Wind Power on Control Performance Standards,” under review, IEEE Trans on Pwr Sys.
Study results • Measures to improve CPS1, CPS2: • M1: Increase primary frequency control capability in Area 1 • M2: Increase the forecast accuracy of wind power • M3: Control wind power output to be no more than a band around forecasted value • M4: Combining control areas. C. Wang and J. McCalley, “Impact of Wind Power on Control Performance Standards,” under review, IEEE Trans on Pwr Sys.
Why Does CPS1 CPS2 Degradation Matter? • NERC penalties • Indication of greater frequency variability: • Some loads may lose performance (induction motors) • UFLS relay operation • Volts per Hz relay operation • Lifetime reduction of turbine blades • Frequency dip may increase for given loss of generation • Indication of greater ACE variability: • Increased inadvertent flows • Increase control action of generators • Indication BA is “leaning on” others MOST IMPORTANT FACTORS QUESTION: Why do we divide the interconnection into BAs?
Do nothing: fossil-plants provide reg & LF (and die ). • Improve forecasts (M2) • Increase control of the wind generation • Control wind to band around forecasted value (M3) • Provide wind with primary control • Reg down (4%/sec), but spills wind following the control • Reg up, but spills wind continuously • Limit wind generation ramp rates • Limit of increasing ramp is easy to do • Limit of decreasing ramp is harder, but good forecasting can warn of impending decrease and plant can begin decreasing in advance • Increase non-wind MW ramping capability during periods of expected high variability using one or more of the below (M1): • Conventional generation • Load control • Storage • Expand control areas • Combine control areas (M4) Solutions to variability & uncertainty 15