Download
1 / 73
730 likes | 784 Vues
This tutorial explores techniques for approximating query results to speed up data analysis. Covering topics such as synopses, histograms, wavelets, and more, it presents methods for faster, approximate query answering in decision support systems (DSS). Learn about online vs. precomputed approaches, commercial offerings, and advanced techniques for efficient data processing. Explore how approximate query processing can provide quick answers for aggregate queries in seconds, with error guarantees, making it ideal for exploratory data analysis and DSS applications. Approximate query processing is essential for handling large datasets and improving response times in SQL queries.

E N D
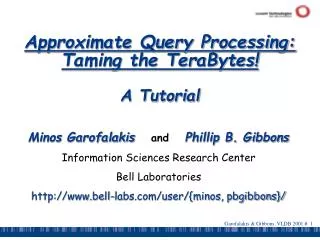
Approximate Query Processing:Taming the TeraBytes!A Tutorial Minos Garofalakis and Phillip B. Gibbons Information Sciences Research Center Bell Laboratories http://www.bell-labs.com/user/{minos, pbgibbons}/
Outline • Intro & Approximate Query Answering Overview • Synopses, System architecture, Commercial offerings • One-Dimensional Synopses • Histograms, Samples, Wavelets • Multi-Dimensional Synopses and Joins • Multi-D Histograms, Join synopses, Wavelets • Set-Valued Queries • Using Histograms, Samples, Wavelets • Discussion & Comparisons • Advanced Techniques & Future Directions • Dependency-based, Workload-tuned, Streaming data • Conclusions
Introduction & Motivation • Exact answers NOT always required • DSS applications usually exploratory: early feedback to help identify “interesting” regions • Aggregate queries: precision to “last decimal” not needed • e.g., “What percentage of the US sales are in NJ?” (display as bar graph) • Preview answers while waiting. Trial queries • Base data can be remote or unavailable: approximate processing using locally-cached data synopses is the only option DecisionSupport Systems(DSS) SQL Query Exact Answer Long Response Times!
Fast Approximate Answers • Primarily for Aggregate queries • Goal is to quickly report the leading digits of answers • In seconds instead of minutes or hours • Most useful if can provide error guarantees E.g., Average salary $59,000 +/- $500 (with 95% confidence) in 10 seconds vs. $59,152.25 in 10 minutes • Achieved by answering the query based on samples or other synopses of the data • Speed-up obtained because synopses are orders of magnitude smaller than the original data
Approximate Query Answering Basic Approach 1: Online Query Processing • e.g., Control Project [HHW97, HH99, HAR00] • Sampling at query time • Answers continually improve, under user control
Approximate Query Answering Basic Approach 2: Precomputed Synopses • Construct & store synopses prior to query time • At query time, use synopses to answer the query • Like estimation in query optimizers, but • reported to the user (need higher accuracy) • more general queries • Need to maintain synopses up-to-date • Most work in the area based on the precomputed approach • e.g., Sample Views [OR92, Olk93], Aqua Project [GMP97a, AGP99,etc]
The Aqua Architecture SQL Query Q Data Warehouse (e.g., Oracle) Q Network Result HTML XML Browser Excel Warehouse Data Updates • Picture without Aqua: • User poses a query Q • Data Warehouse executes Q and returns result • Warehouse is periodically updated with new data
The Aqua Architecture Rewriter [GMP97a, AGP99] Picture with Aqua: • Aqua is middleware, between the user and the warehouse • Aqua Synopses are stored in the warehouse • Aqua intercepts the user query and rewrites it to be a query Q’ on the synopses. Data warehouse returns approximate answer SQL Query Q Data Warehouse (e.g., Oracle) Q’ Network Result (w/ error bounds) HTML XML Browser Excel AQUA Synopses Warehouse Data Updates AQUA Tracker
Online vs. Precomputed Online: + Continuous refinement of answers (online aggregation) + User control: what to refine, when to stop + Seeing the query is very helpful for fast approximate results + No maintenance overheads +See [HH01] Online Query Processing tutorial for details Precomputed: + Seeing entire data is very helpful (provably & in practice) (But must construct synopses for a family of queries) + Often faster: better access patterns, small synopses can reside in memory or cache +Middleware: Can use with any DBMS, no special index striding + Also effective for remote or streaming data
Commercial DBMS • Oracle, IBM Informix: Sampling operator (online) • IBM DB2: “IBM Almaden is working on a prototype version of DB2 that supports sampling. The user specifies a priori the amount of sampling to be done.” • Microsoft SQL Server: “New auto statistics extract statistics [e.g., histograms] using fast sampling, enabling the Query Optimizer to use the latest information.” The index tuning wizard uses sampling to build statistics. • see [CN97, CMN98, CN98] In summary, not much announced yet
Outline • Intro & Approximate Query Answering Overview • One-Dimensional Synopses • Histograms: Equi-depth, Compressed, V-optimal, Incremental maintenance, Self-tuning • Samples: Basics, Sampling from DBs, Reservoir Sampling • Wavelets: 1-D Haar-wavelet histogram construction & maintenance • Multi-Dimensional Synopses and Joins • Set-Valued Queries • Discussion & Comparisons • Advanced Techniques & Future Directions • Conclusions
Histograms • Partition attribute value(s) domain into a set of buckets • Issues: • How to partition • What to store for each bucket • How to estimate an answer using the histogram • Long history of use for selectivity estimation within a query optimizer [Koo80], [PSC84], etc. • [PIH96] [Poo97] introduced a taxonomy, algorithms, etc.
1-D Histograms: Equi-Depth 1 2 2 3 4 7 8 9 1010 10 10 11 11 12 12 14 16 16 18 19 20 20 20 • Goal: Equal number of rows per bucket(B buckets in all) • Can construct by first sorting then taking B-1 equally-spaced splits • Faster construction: Sample & take equally-spaced splits in sample • Nearly equal buckets • Can also use one-pass quantile algorithms (e.g., [GK01]) Count in bucket 1 2 3 4 5 6 7 8 9 10 11 12 13 14 15 16 17 18 19 20 Domain values
1-D Histograms: Equi-Depth Split 4 5 6 7 8 9 4 5 6 7 8 9 • Can maintain using one-pass algorithms (insertions only), or • Use a backing sample [GMP97b]: Maintain a larger sample on disk in support of histogram maintenance • Keep histogram bucket counts up-to-date by incrementing on row insertion, decrementing on row deletion • Merge adjacent buckets with small counts • Split any bucket with a large count, using the sample to select a split value, i.e, take median of the sample points in bucket range • Keeps counts within a factor of 2; for more equal buckets, can recompute from the sample Count in bucket 1 2 3 4 5 6 7 8 9 10 11 12 13 14 15 16 17 18 19 20 Domain values
1-D Histograms: Compressed • Create singleton buckets for largest values, equi-depth over the rest • Improvement over equi-depth since get exact info on largest values, e.g., join estimation in DB2 compares largest values in the relations Construction: Sorting + O(B log B) + one pass; can use sample Maintenance: Split & Merge approach as with equi-depth, but must also decide when to create and remove singleton buckets [GMP97b] [PIH96] 1 2 3 4 5 6 7 8 9 10 11 12 13 14 15 16 17 1819 20
1-D Histograms: V-Optimal [IP95] defined V-optimal & showed it minimizes the average selectivity estimation error for equality-joins & selections • Idea: Select buckets to minimize frequency variance within buckets • [JKM98] gave an O(B*N^2) time dynamic programming algorithm • F[k]= freq. of valuek; AVGF[i:j]= avg freq for valuesi..j • SSE[i:j] = sum{k=i..j} (F[k]^2 – (j-i+1)*AVGF[i:j]^2) • Fori=1..N, computeP[i] = sum{k=1..i} F[k]&Q[i] = sum{k=1..i} F[k]^2 • Then can compute anySSE[i:j]in constant time • LetSSEP(i,k)= min SSE forF[1]..F[i]usingkbuckets • ThenSSEP(i,k) = min{j=1..i-1} (SSEP(j,k-1) + SSE[j+1:i]), i.e., suffices to consider all possible left boundaries for kth bucket • Also gave faster approximation algorithms
Answering Queries: Histograms Need number of distinct in each bucket 1 2 3 4 5 6 7 8 9 10 11 12 13 14 15 16 17 18 19 20 1 2 3 4 5 6 7 8 9 10 11 12 13 14 15 16 17 18 19 20 3 2 1 2 3 1 • Answering queries from 1-D histograms (in general): • (Implicitly) map the histogram back to an approximate relation, & apply the query to the approximate relation • Continuous value mapping [SAC79]: Count spread evenly among bucket values - Uniform spread mapping [PIH96]:
Self-Tuning 1-D Histograms 30 30 30 30 25 25 16 16 12 12 12 12 12 12 10 10 10 10 10 10 1 10 1 10 11 20 11 20 21 30 21 30 31 60 31 60 61 64 61 64 65 69 65 69 70 70 70 70 71 79 71 79 80 89 80 89 90 99 90 99 20 15 15 1. Tune Bucket Frequencies: • Compare actual selectivity to histogram estimate • Use to adjust bucket frequencies [AC99] query range Actual = 60 Estimate = 40 Error = +20 - Divide d*Error proportionately, d=dampening factor d=½ of Error = +10 So divide +4,+3,+3
Self-Tuning 1-D Histograms 69 split in 3 merge merge split 30 25 17 13 13 13 10 10 10 1 10 11 20 21 30 31 60 61 64 65 69 70 70 71 79 80 89 90 99 36 25 23 23 23 23 17 15 15 10 1 20 21 30 31 69 70 70 71 73 74 76 77 79 80 89 90 94 95 99 2. Restructure: • Merge buckets of near-equal frequencies • Split large frequency buckets Also Extends to Multi-D
Sampling: Basics • Idea: A small random sample S of the data often well-represents all the data • For a fast approx answer, apply the query to S & “scale” the result • E.g., R.a is {0,1}, S is a 20% sample select count(*) from R where R.a = 0 select 5 * count(*) from S where S.a = 0 R.a 1 1 0 1 1 1 1 1 0 0 0 0 1 1 1 1 1 0 1 1 1 0 1 0 1 1 0 1 1 0 Red = in S Est. count = 5*2 = 10, Exact count = 10 • Unbiased: For expressions involving count, sum, avg: the estimator • is unbiased, i.e., the expected value of the answer is the actual answer, • even for (most) queries with predicates! • Leverage extensive literature on confidence intervals for sampling • Actual answer is within the interval [a,b] with a given probability • E.g., 54,000 ± 600 with prob 90%
Sampling: Confidence Intervals Method 90% Confidence Interval (±) Guarantees? Central Limit Theorem 1.65 * (S) / sqrt(|S|) as |S| Hoeffding 1.22 * (MAX-MIN) / sqrt(|S|) always Chebychev (known (R)) 3.16 * (R) / sqrt(|S|) always Chebychev (est. (R)) 3.16 * (S) / sqrt(|S|) as (S) (R) • If predicates, S above is subset of sample that satisfies the predicate • Quality of the estimate depends only on thevariance in R & |S| after the predicate: So 10K sample may suffice for 10B row relation! • Advantage of larger samples: can handle more selective predicates Confidence intervals for Average: select avg(R.A) from R (Can replace R.A with any arithmetic expression on the attributes in R) (R) = standard deviation of the values of R.A; (S) = s.d. for S.A
Sampling from Databases • Sampling disk-resident data is slow • Row-level sampling has high I/O cost: • must bring in entire disk block to get the row • Block-level sampling: rows may be highly correlated • Random access pattern, possibly via an index • Need acceptance/rejection sampling to account for the variable number of rows in a page, children in an index node, etc • Alternatives • Random physical clustering: destroys “natural” clustering • Precomputed samples: must incrementally maintain (at specified size) • Fast to use: packed in disk blocks, can sequentially scan, can store as relation and leverage full DBMS query support, can store in main memory
One-Pass Uniform Sampling • Best choice for incremental maintenance • Low overheads, no random data access • Reservoir Sampling [Vit85]: Maintains a sample S of a fixed-size M • Add each new item to S with probability M/N, where N is the current number of data items • If add an item, evict a random item from S • Instead of flipping a coin for each item, determine the number of items to skip before the next to be added to S • To handle deletions, permit |S| to drop to L < M, e.g., L = M/2 • remove from S if deleted item is in S, else ignore • If |S| = M/2, get a new S using another pass (happens only if delete roughly half the items & cost is fully amortized) [GMP97b]
One-Dimensional Haar Wavelets [1.5, 4] [0.5, 0] [2.75] [-1.25] Haar wavelet decomposition: [2.75, -1.25, 0.5, 0, 0, -1, -1, 0] • Wavelets: mathematical tool for hierarchical decomposition of functions/signals • Haar wavelets: simplest wavelet basis, easy to understand and implement • Recursive pairwise averaging and differencing at different resolutions Resolution Averages Detail Coefficients 3 [2, 2, 0, 2, 3, 5, 4, 4] ---- 2 [2, 1, 4, 4] [0, -1, -1, 0] 1 0
Haar Wavelet Coefficients + 2.75 - 2.75 + + - -1.25 -1.25 - -1 0 0.5 -1 0 0 + + - + - - 0.5 + 0 + - + - + - + - - + - + 2 2 0 2 3 5 4 4 0 + - -1 + - -1 + 0 • Hierarchical decomposition structure (a.k.a. “error tree”) Coefficient “Supports” Original data
Wavelet-based Histograms [MVW98] • Problem: range-query selectivity estimation • Key idea: use a compact subset of Haar/linear wavelet coefficients for approximating the data distribution • Steps • compute cumulative data distribution C • compute Haar (or linear) wavelet transform of C • coefficient thresholding : only b<<|C| coefficients can be kept • take largest coefficients in absolutenormalized value • Haar basis: divide coefficients at resolution j by • Optimal in terms of the overall Mean Squared (L2) Error • Greedy heuristic methods • Retain coefficients leading to large error reduction • Throw away coefficients that give small increase in error
Using Wavelet-based Histograms C[a] • Selectivity estimation: sel(a<= X<= b) = C’[b] - C’[a-1] • C’ is the (approximate) “reconstructed” cumulative distribution • Time: O(min{b, logN}), where b = size of wavelet synopsis (no. of coefficients), N= size of domain • Empirical results over synthetic data • Improvements over random sampling and histograms (MaxDiff) • At most logN+1 coefficients are needed to reconstruct any C value
Dynamic Maintenance of Wavelet-based Histograms [MVW00] Change propagates up to the root coefficient d • Build Haar-wavelet synopses on the original data distribution • Similar accuracy with CDF, makes maintenance simpler • Key issues with dynamic wavelet maintenance • Change in single distribution value can affect the values of many coefficients (path to the root of the decomposition tree) d+ • As distribution changes, “most significant” (e.g., largest) coefficients can also change! • Important coefficients can become unimportant, and vice-versa
Outline • Intro & Approximate Query Answering Overview • One-Dimensional Synopses • Multi-Dimensional Synopses and Joins • Multi-dimensional Histograms • Join sampling • Multi-dimensional Haar Wavelets • Set-Valued Queries • Discussion & Comparisons • Advanced Techniques & Future Directions • Conclusions
Multi-dimensional Data Synopses 35 Salary 90 40 120 20 10 Age • Problem: Approximate the joint data distribution of multiple attributes • Motivation • Selectivity estimation for queries with multiple predicates • Approximating OLAP data cubes and general relations • Conventional approach: Attribute-Value Independence (AVI) assumption • sel(p(A1) & p(A2) & . . .) = sel(p(A1)) * sel(p(A2) * . . . • Simple -- one-dimensional marginals suffice • BUT: almost always inaccurate, gross errors in practice (e.g., [Chr84, FK97, Poo97]
Multi-dimensional Histograms Approximate Distribution 16 10 • Use small number of multi-dimensional buckets to directly approximate the joint data distribution • Uniform spread & frequency approximation within buckets • n(i) = no. of distinct values along Ai, F = total bucket frequency • approximate data points on a n(1)*n(2)*. . . uniform grid, each with frequency F / (n(1)*n(2)*. . .) Actual Distribution (ONE BUCKET) 35 90 40 120 20
Multi-dimensional Histogram Construction • Construction problem is much harder even for two dimensions [MPS99] • Multi-dimensional equi-depth histograms [MD88] • Fix an ordering of the dimensions A1, A2, . . ., Ak, let kth root of desired no. of buckets, initialize B = { data distribution } • For i=1, . . ., k: Split each bucket in B in equi-depth partitions along Ai; return resulting buckets to B • Problems: limited set of bucketizations; fixed and fixed dimension ordering can result in poor partitionings • MHIST-p histograms [PI97] • At each step • Choose the bucket b in B containing the attribute Ai whose marginal is the most in need of partitioning • Split b along Ai into p (e.g., p=2) buckets
Equi-depth vs. MHIST Histograms 1 1 5 30 30 4 2 2 4 200 200 10 10 50 150 50 150 150 150 50 50 150 150 5 3 3 280 280 Equi-depth (a1=2,a2=3) [MD88] MHIST-2 (MaxDiff) [PI97] A2 A2 460 360 250 A1 A1 450 280 340 • MHIST: choose bucket/dimension to split based on its criticality ; allows for much larger class of bucketizations (hierarchical space partitioning) • Experimental results verify superiority over AVI and equi-depth
Other Multi-dimensional Histogram Techniques -- STHoles [BCG01] |q&b|=160 b1 b1 q 160 Refine 40 b2 b2 b3 b3 b5 b4 b4 150 100 300 • Multi-dimensional, workload-based histograms • Allow bucket nesting -- “bucket tree” • Intercept query result stream and count |q b| for each bucket b (< 10% overhead in MS SQL Server 2000) • Drill “holes” in b for regions of different tuple density and “pull” them out as children of b (first-class buckets) • Consolidate/merge buckets of similar densities (keep #buckets constant) 200 150 100 300
Sampling for Multi-D Synopses Size of Join of samples = 3 • Taking a sample of the rows of a table captures the attribute correlations in those rows • Answers are unbiased & confidence intervals apply • Thus guaranteed accuracy for count, sum, and average queries on single tables, as long as the query is not too selective • Problem with joins [AGP99,CMN99]: • Join of two uniform samples is not a uniform sample of the join • Join of two samples typically has very few tuples Foreign Key Join 40% Samples in Red Size of Actual Join = 30 3 1 0 3 7 3 7 1 4 2 4 0 1 21270 8 5 1 9 1 0 7 1 3 8 2 0 0 1 2 3 4 5 6 7 8 9
Join Synopses for Foreign-Key Joins [AGP99] • Based on sampling from materialized foreign key joins • Typically < 10% added space required • Yet, can be used to get a uniform sample of ANY foreign key join • Plus, fast to incrementally maintain • Significant improvement over using just table samples • E.g., for TPC-H query Q5 (4 way join) • 1%-6% relative error vs. 25%-75% relative error, for synopsis size = 1.5%, selectivity ranging from 2% to 10% • 10% vs. 100% (no answer!) error, for size = 0.5%, select. = 3%
Multi-dimensional Haar Wavelets • Basic “pairwise averaging and differencing” ideas carry over to multiple data dimensions • Two basic methodologies -- no clear winner [SDS96] • Standard Haar decomposition • Non-standard Haar decomposition • Discussion here: focus on non-standard decomposition • See [SDS96, VW99] for more details on standard Haar decomposition • [MVW00] also discusses dynamic maintenance of standard multi-dimensional Haar wavelet synopses
Two-dimensional Haar Wavelets -- Non-standard decomposition Averaging & Differencing + - c d a b - + “Supports” + - RECURSE Wavelet Transform Array: (a+b-c-d)/4 (a-b-c+d)/4 (a+b+c+d)/4 (a-b+c-d)/4
Constructing the Wavelet Decomposition Relation (ROLAP) Representation 3 2 1 0 Attr2 6 3 4 0 1 2 3 Attr1 Joint Data Distribution Array • Joint data distribution can be very sparse! • Key to I/O-efficient decomposition algorithms: Work off the ROLAP representation • Standard decomposition [VW99] • Non-standard decomposition [CGR00] • Typically require a small (logarithmic) number of passes over the data
Range-sum Estimation Using Wavelet Synopses + - • Coefficient thresholding • As in 1-d case, normalizing by appropriate constants and retaining the largest coefficients minimizes the overall L2 error • Range-sums:selectivity estimation or OLAP-cube aggregates [VW99] (“measure attribute” as count) • Only coefficients with support regions intersecting the query hyper-rectangle can contribute • Many contributions can cancel each other [CGR00, VW99] Contribution to range sum = 0 Only nodes on the path to range endpoints can have nonzero contributions (Extends naturally to multi-dimensional range sums) Decomposition Tree (1-d) Query Range
Outline • Intro & Approximate Query Answering Overview • One-Dimensional Synopses • Multi-Dimensional Synopses and Joins • Set-Valued Queries • Error Metrics • Using Histograms • Using Samples • Using Wavelets • Discussion & Comparisons • Advanced Techniques & Future Directions • Conclusions
Approximating Set-Valued Queries Subset Approximation (e.g., from 20% sample) Query Answer “Better” Approximation S a l a r y Age • Problem: Use synopses to produce “good” approximate answers to generic SQL queries -- selections, projections, joins, etc. • Remember: synopses try to capture the joint data distribution • Answer (in general) = multiset of tuples • Unlike aggregate values, NO universally-accepted measures of “goodness” (quality of approximation) exist
Error Metrics for Set-Valued Query Answers • Need an error metric for (multi)sets that accounts for both • differences in element frequencies • differences in element values • Traditional set-comparison metrics (e.g., symmetric set difference, Hausdorff distance) fail • Proposed Solutions • MAC (Match-And-Compare) Error [IP99]: based on perfect bipartite graph matching • EMD (Earth Mover’s Distance) Error [CGR00, RTG98]: based on bipartite network flows
Using Histograms for Approximate Set-Valued Queries [IP99] • Store histograms as relations in a SQL database and define a histogram algebra using simple SQL queries • Implementation of the algebra operators (select, join, etc.) is fairly straightforward • Each multidimensional histogram bucket directly corresponds to a set of approximate data tuples • Experimental results demonstrate histograms to give much lower MAC errors than random sampling • Potential problems • For high-dimensional data, histogram effectiveness is unclear and construction costs are high [GKT00] • Join algorithm requires expanding into approximate relations • Can be as large (or larger!) than the original data set
Set-Valued Queries via Samples • Applying the set-valued query to the sampled rows, we very often obtain a subset of the rows in the full answer • E.g., Select all employees with 25+ years of service • Exceptions include certain queries with nested subqueries (e.g., select all employees with above average salaries: but the average salary is known only approximately) • Extrapolating from the sample: • Can treat each sample point as the center of a cluster of points (generate approximate points, e.g., using kernels [BKS99, GKT00]) • Alternatively, Aqua [GMP97a, AGP99] returns an approximate count of the number of rows in the answer and a representative subset of the rows (i.e., the sampled points) • Keeps result size manageable and fast to display
Approximate Query Processing Using Wavelets [CGR00] Compressed domain (FAST) Relation domain (SLOW) • Reduce relations into compact wavelet-coefficient synopses Entire query processing in the compressed (wavelet) domain Query Results in Wavelet Domain Querying in Wavelet Domain Render Wavelet Synopses Final Approximate Results Approximate Relations Querying in Relation Domain Render
Wavelet Query Processing join project select select • Each operator(e.g., select, project, join, aggregates, etc.) • input: set of wavelet coefficients • output: set of wavelet coefficients • Finally, rendering step • input: set of wavelet coefficients • output: (multi)set of tuples render set of coefficients set of coefficients set of coefficients
Selection -- Wavelet Domain D1 + - + - - + D2 D1 + - + - Query Range + - + - + - D2
Discussion & Comparisons (1) • Histograms & Wavelets: Limited by “curse of dimensionality” • Rely on data space partitioning in “regions” • Ineffective above 5-6 dimensions • Value/frequency uniformity assumptions within buckets break down in medium-to-high dimensionalities!! • Sampling: No such limitations, BUT... • Ineffective for ad-hoc relational joins over arbitrary schemas • Uniformity property is lost • Quality guarantees degrade • Effectiveness for set-valued approximate queries is unclear • Only (very) small subsets of the answer set are returned (especially, when joins are present)
Discussion & Comparisons (2) • Histograms & Wavelets: Compress data by accurately capturing rectangular “regions” in the data space • Advantage over sampling for typical, “range-based” relational DB queries • BUT, unclear how to effectively handle unordered/non-numeric data sets (no such issues with sampling...) • Sampling: Provides strong probabilistic quality guarantees (unbiased answers) for individual aggregate queries • Histograms & Wavelets: Can guarantee a bound on the overall error (e.g., L2) for the approximation, BUT answers to individual queries can be heavily biased!! No clear winner exists!! (Hybrids??)