Download
1 / 26
260 likes | 571 Vues
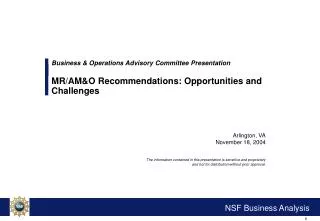
Industrial Technologies Program State Energy Advisory Board Meeting Arlington, VA November 16-18, 2005 Jacques Beaudry-Losique, Program Manager Industrial Technologies Program, EERE U.S. Department of Energy Overview Industrial Energy Context

E N D
Industrial Technologies Program State Energy Advisory Board Meeting Arlington, VA November 16-18, 2005 Jacques Beaudry-Losique, Program Manager Industrial Technologies Program, EEREU.S. Department of Energy
Overview • Industrial Energy Context • The Industrial Technologies Program’s (ITP’s) Focus • Results & Highlights • Save Energy Now Initiative • State Outreach & Resources
Industry: Critical to National Energy Policy 2004 Energy Use* • Uses more energy than any other single sector; >1/3 of U.S. energy consumption • Accounts for more than 40% of U.S.natural gas demand • Accounts for 28% of U.S. electricity demand • Produces approximately 30% of U.S greenhouse gas emissions Transportation 27.9% Industry 33.6% Commercial 17.4% Residential 21.1% *Includes electricity losses Source: DOE/EIA Monthly Energy Review 2004 (preliminary)
U.S. Energy Consumption by Industry 8000 All Energy Natural Gas 6000 Natural Gas Liquids Other Trillion Btu Computers 4000 Plastics Glass Fabricated Metals Transport Equip. 2000 Mining 0 Petroleum & Forest Food & Other Chemicals Iron & Steel Aluminum Coal Products Products Beverage (1,922 TBtu NG) Source: 1998 Manufacturing Energy Consumption Survey (MECS)
U. S. Consumption of Natural GasBy Sector, 2004 Transportation 0.7 Quads Industrial 8.8 Quads Power 5.5 Quads Commercial 3.1 Quads Residential 5.0 Quads Industry > 40% of total U.S. Natural Gas Use Source: DOE/EIA Monthly Energy Review 2004 (preliminary)
Challenges for Energy-Intensive Industries • International technology/cost competition • Uncertain environmental constraints • Limited access to LT investment capital • Uncertain long-term economics • Natural gas prices and supply • Henry Hub spot price on November 8 2005, was $11.89/MMBtu • “Many companies have been unable to pass higher energy costs on to their customers, which has sharply reduced their profit margins” National Energy Policy, pages 2-4
The Industrial Technologies Program (ITP) Delivering Technology Solutions Collaborative R&D • Energy-intensiveProcess Technologies • Crosscutting Technologies Technology Delivery Partnerships • Assessments • Training & Tools
Types of R&D Supported by ITP Process specific • Hybrid Distillation • Process Intensification Crosscutting • Iso-thermal Melting • Advanced Water Removal • High-Efficiency Pulping • Inferential-based Process Control • Advanced Thermo- Electric Materials • Super Boiler • Ultra-Hard Materials • Natural Gas Alternatives Other Trillion Btu Computers • Next Generation Steel-making Plastics Glass Fabricated Metals Transport Equip. Mining
Emerging Topic: Fuel/Feedstock Flexibility Total Nat Gas Displacement(1012 Btu) ITP Strategies • Near-Term (0 – 2 years): • Redirect TD to pursue natural gas saving opportunities via: • Technology and market assessments • Application guides explaining opportunities, implementation strategies, permitting issues, etc. • Training and education • Longer-Term (>2 years):Significant process changes and permitting required • Explore opportunities in FE and other EERE technologies • Conduct applied R&D for industrial applications
Technology Delivery Resources • DOE-supported energy assessments (IAC,CTA,PWA) • Qualified specialists • Energy efficiency trainingfor plant staff • Energy analysis software tools • Case studies and information 877-337-3463 www.eere.energy.gov/bestpractices www.energysavers.gov/industry Info Center: Websites:
Technology Delivery Focus Percent of Total Industrial Energy U.S. Manufacturing Plants: By Size Small & Medium 47% Number of U.S. Plants Large 53% Focus of CTA, PWA Teams Focus of IAC Teams Small Plants<$100K Mid-Size Plants$100K-$2M Large Plants>$2M Category:Annual EnergyCosts All U.S. Plants 1998 EIA MECS
Annual energy savings of 121 trillion Btu (87 commercial technologies currently tracked) Cumulative energy savings of 2.6 Quads since 1976 Cumulative production costsavings of $16.5 billionsince 1976 Initiated tracking of 11 new commercialized technologies 2002 Program Results
Enhancement of Aluminum Alloy Forgings through Rapid Preheating of Billets Imaging Ahead of Mining Smart Screening Systems Advanced Glass Furnace Model Four “R&D 100” Award Winners in 2004
Chemicals through 1/11/06 ~ $10 million SBIR through 12/2/05 ~ $10 million Materials for EE Completed ~ $ 7.6 million Industrial Assessment Centers through 1/24/06 ~ $ 6 million Materials (Labs) Completed ~ $ 5 million Innovative Energy Systems through 1/25/06 ~ $ 4 million Inventions & Innov. Completed ~ $ 2 million FY2006 ITP RD&D Solicitations
“Save Energy Now” Initiative Goals: • Encourage industry to voluntarily reduce its energy usage in a period of tight supplies by working with America’s largest energy-intensive plants • Create momentum to significantly improve energy efficiency practices throughout the manufacturing sector
Energy Savings Assessments • 200 assessments of targeted industrial systems • Assessments done by teams composed of DOE Qualified Energy Experts and plant personnel • Teams will focus on either steam generation or process heating • Plant personnel and affiliates will be trained on DOE efficient tools • ESA Report identifies potential energy and cost savings Other4% Facilities 8% Electrochemical - 2% ProcessCooling1% Manufacturing Energy Use by Type of System (%) Steam 35% Motor Systems 12% Process Heating 38% Note: Does not include off-site losses
Robust Partnerships to Reach Plants • Allied Partners • States • Utilities • Equipment Suppliers & Service Companies • Trade Associations • Replication within Industrial Companies
For the Latest Information … Save Energy Now Website www.eere.energy.gov/industry/saveenergynow EERE Information Center - Call: 1-877-337-3463
Selected State and ITP Accomplishments • Texas Technology Showcase • Ohio Technology Showcase • California Energy Fairs • Saving Water; Saving Energy in Colorado • Nevada Mining Energy Solutions Event • Western US Food Processing Efficiency Initiative
Accelerating State and ITP Results • Leverage market players (e.g., utilities, ITP Allied Partners, Qualified Specialists, and regional groups such as the Northwest Energy Efficiency Alliance) • Deliver SEP special projects through largest energy consuming plants • Facilitate cross-pollination of activities and results across corporate facilities • Increase awareness of ITP emerging technologies and commercialization capabilities • Develop common impacts tracking system and metrics • Strategically communicate successes to right audiences