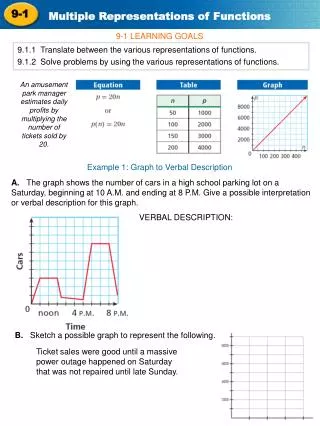
Multiple Representations of Functions
Multiple Representations of Functions. Anne Bartel & Barb Everhart. Goals. Distinguish among different types of functions using tables, graphs, equations, and real life situations. Make connections among the different representations of functions.

Multiple Representations of Functions
E N D
Presentation Transcript
Multiple Representations of Functions Anne Bartel & Barb Everhart
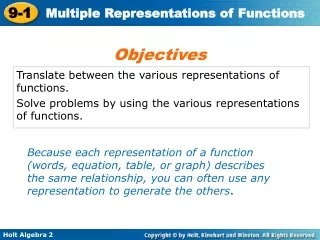
Goals Distinguish among different types of functions using tables, graphs, equations, and real life situations. Make connections among the different representations of functions. See slope in tables, graphs, equations, and real life situations. Investigate slope as a rate of change. Help children make connections between y = mx and y = mx + b.
Review of Equations What are the different ways that children solve linear equations? • Basic facts • Generate and evaluate • Undoing • Cover-up • Transposing • Equivalent equations
Summative Assessment • Look at each item • Predict: Which strategies would your students use?
Share in Grade-level Groups • What strategies did you teach? • What were your reasons for teaching those strategies? • What did your students learn?
Baby Girls • According to growth tables used by pediatricians the median birth weight of baby girls increases at a constant rate each month for the first six months of life. The median birth weight of baby girls is 7.0 pounds and they typically gain 1.5 pounds per month for the first six months after birth. • Make a table for this data; then make a scatter plot.
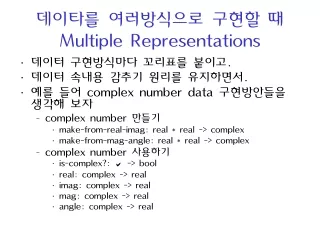
Rule of 3 Plus 1 The growth of understanding about mathematical ideas runs along a continuum. The more a student understands something, the more connections s/he can make among representations.
Turtle Race Sorting Activity • The six teams at Anthony Middle School were having a turtle race. The turtles raced along a track. Some of the turtles ran faster than other turtles in previous races so they started at different places along the track to be fair. The six teams were supposed to keep track of their turtle’s progress using a graph, table, and equation. They were asked to also write a description of their turtle’s progress.
Turtle Race Sorting Activity It was windy on the day of the race so several of the groups lost some of their data. Please cut out the different graphs, tables, equations, and descriptions below and match them to the appropriate turtle. Fill in any missing tables, graphs, equations, and/or descriptions.
Turtle Race Sorting Activity • Describe the graphs: • Gary’s? • Puff’s? • Bob’s? • Read your stories for Bob • How are Sandi’s and Puff’s graphs different?
Think - Pair - Share: • What follow-up questions would you ask your students in this activity to pull out the mathematics?
What is slope? Write your definition of slope of a line:
Student Difficulty with Slope A) Which line is steeper?
Student Difficulty with Slope B) Situation - Steepness Which ramp is steeper?
Student Difficulty with Slope B) Rate of Change -- speed Who is walking faster?
Student Difficulty with Slope C) Rate of Change -- Table What is the slope in each of these tables?(Children tend to focus on difference rather than ratio)
Student Difficulty with Slope D) Equation -- What it goes up by, start, etc. What is the slope of the line described by the equation y = 3x + 2? Students need to make connections between these valuesand the situation.
Gears The Connected Gears Problem You have two gears on your table. Gear A (orange) has 8 teeth, and gear B (blue) has 10 teeth. Answer the following questions. • If you turn gear A a certain number of times, does gear B turn more revolutions, fewer revolutions, or the same number of revolutions? How can you tell?
Gears The Connected Gears Problem You have two gears on your table. Gear A (orange) has 8 teeth, and gear B (blue) has 10 teeth. Answer the following questions. Devise a way to keep track of how many revolutions gear A makes. Devise a way to keep track of gear B’s revolutions. How can you keep track of both at the same time?
The Connected Gears Problem • How many rotations will gear B go through if gear A goes through one rotation? How will this activity help your students develop a more sophisticated understanding of slope? ? 1
Leaky Faucet Cassandra decided to see how fast her bathtub faucet was leaking. She got a large container and put it under her faucet when she got up in the morning, and then checked periodically during the day to see how much water was in the container. She wrote the times and the amounts down. They are in the table on the right.
What do we want to emphasize? Tables • Use a mix of well-ordered tables and not well-ordered tables. • Avoid using “it goes up by” language. • Focus on relationships across measures. • Multiplicative thinking is key.
What do we want to emphasize? Equations • Focus on meaning of each term.
What do we want to emphasize? Graphs • Use slope triangles.
What do we want to emphasize? Representations • Make connections among representations.
What do we want to emphasize? Graphing Calculator • Using the Graphing Calculator: Problem with “It goes up by.”
Slope – Rate of Change? Paper Bridge Problem from CMP Thinking with Mathematical Models • Fold 15 sheets of paper individually; fold 1 inch up on each side. • Stack the sheets to build paper bridges one at a time: 1 layer thick 2 layers thick 3 layers thick, etc.
Slope – Rate of Change? Place each bridge between 2 books or 2 tables of equal height. Place pennies, one at a time, into a cup in the center of the bridge. Record the number of pennies that crumples the bridge. (Be sure to throw out used bridges.) Make a mathematical model to describe the relationship between thickness and breaking weight. Use the model to estimate the breaking weight for 6- and 7-layer bridges.
Slope – Rate of Change The 9 means it takes 9 pennies to break each additional layer of the bridge. The 9 means it takes 9 pennies to break each layer of the bridge.
Goals Distinguish among different types of functions using tables, graphs, equations, and real life situations. Make connections among the different representations of functions. See slope in tables, graphs, equations, and real life situations. Investigate slope as a rate of change. Help children make connections between y = mx and y = mx + b.
Evaluation On an index card, please record: P: one positive from today’s work M: one ‘minus’ or concern from today’s work I: something that you found interestingor intriguing from today’s work. Thanks for your feedback.