Download
1 / 24
240 likes | 367 Vues
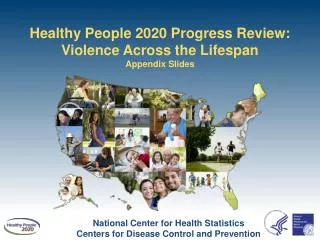
Healthy People 2020 Progress Review: Violence Across the Lifespan Appendix Slides. National Center for Health Statistics Centers for Disease Control and Prevention. Injury and Violence Prevention. Ten Leading Causes of Death, Ages 15-24, 2010. 3,743. Source: WISQARS.

E N D
Healthy People 2020 Progress Review: Violence Across the Lifespan Appendix Slides National Center for Health StatisticsCenters for Disease Control and Prevention
Ten Leading Causes of Death, Ages 15-24, 2010 3,743 Source: WISQARS
Leading Causes of Injury Deaths, 2010 SOURCE: National Vital Statistics System—Mortality (NVSS-M), CDC/NCHS.
Leading Causes of Nonfatal Injury, 2011 (treated + released) SOURCE: National Electronic Injury Surveillance System–All Injury Program (NEISS–AIP), CDC/NCIPC, and Consumer Product Safety Commission (CPSC)
Leading Causes of Nonfatal Injury, 2011 (hospitalized) SOURCE: National Electronic Injury Surveillance System–All Injury Program (NEISS–AIP), CDC/NCIPC, and Consumer Product Safety Commission (CPSC)
Leading Causes of Nonfatal Injury, 2011 SOURCE: National Electronic Injury Surveillance System–All Injury Program (NEISS–AIP), CDC/NCIPC, and Consumer Product Safety Commission (CPSC)
Weapon Carrying by Adolescents by Grade and Sex, 1999 and 2011 NOTES: I = 95% confidence interval. Data are for the proportion of students in grades 9–12 who report carrying weapons on school property in the past 12 months. SOURCE: Youth Risk Behavior Surveillance System (YRBSS), CDC/NCCDPHP. HP2020 Target: 4.6 Obj. IVP-36 Decrease desired
Initial Emergency Department Visits for Nonfatal Traumatic Brain Injuries, 2007–2010 HP2020 Target: 365.3 Obj. IVP-2.3 Decrease desired NOTES: I = 95% confidence interval. Data are for initial emergency department visits for nonfatal traumatic brain injuries (ICD-9-CM codes 800.0-801.9, 803.0–804.9, 850.0–854.1, 950.1–950.3, 995.55, 959.01 in any of the three diagnostic fields) among the injury ED subset (first listed ICD-9-CM 800–909.2, 909.4, 909.9–994.9, 995.50–995.59, 995.80–995.85, E800–E869, E880–E929, E950–E999) that were not admitted to the hospital or transferred to another facility. Data are age adjusted to the 2000 standard population. SOURCE: National Hospital Ambulatory Medical Care Survey (NHAMCS), CDC/NCHS.
Initial Emergency Department Visits for Nonfatal Traumatic Brain Injuries by Age, 2007–2010 NOTES: I = 95% confidence interval. Data are for initial emergency department visits for nonfatal traumatic brain injuries (ICD-9-CM codes 800.0-801.9, 803.0–804.9, 850.0–854.1, 950.1–950.3, 995.55, 959.01 in any of the three diagnostic fields) among the injury ED subset (first listed ICD-9-CM 800–909.2, 909.4, 909.9–994.9, 995.50–995.59, 995.80–995.85, E800–E869, E880–E929, E950–E999) that were not admitted to the hospital or transferred to another facility. SOURCE: National Hospital Ambulatory Medical Care Survey (NHAMCS), CDC/NCHS. Obj. IVP-2.3 Decrease desired
Leading Cause of Injury Deaths, 1999–2010 Poisoning Motor Vehicle Traffic NOTES: Poisoning data are for ICD-10 codes X40-X49, X60-X69, X85-X90,Y10-Y19, Y35.2. Unintentional poisoning data are for ICD-10 codes X40-X49. Motor Vehicle Crash data are for ICD-10 codes V02-V04 (.1, .9), V09.2, V12-V14 (.3-.9), V19(.4-.6), V20-V28 (.3-.9), V29-V79 (.4-.9), V80 (.3-.5), V81.1, V82.1, V83-V86 (.0-.3), V87 (.0-.8), V89.2.Data are age adjusted to the 2000 standard population. SOURCE: National Vital Statistics System—Mortality (NVSS-M), CDC/NCHS. 2020 Target: 13.1 2020 Target: 12.4 Obj. IVP-13.1 and 9.1 Decrease desired
Poisoning Deaths by Age Group, 1999–2010 55+ years < 18 years 35–54 years 25–34 years NOTES: Data are for ICD-10 codes X40–X49, X60–X69, X85–X90, Y10–Y19, Y35.2, and *U01(.6, .7) reported as underlying cause of death. SOURCE: National Vital Statistics System—Mortality (NVSS-M), CDC/NCHS. 18–24 years Obj. IVP-9.1 and 9.2 Decrease desired
Motor Vehicle Traffic Deaths by Age Group, 1999–2010 65+ years < 18 years 45–64 years 25–44 years 18–24 years NOTES: Data are for ICD-10 codes V02–V04 (.1, .9), V09.2, V12–V14 (.3–.9), V19(.4–.6), V20–V28 (.3–.9), V29–V79 (.4–.9), V80 (.3–.5),V81.1, V82.1, V83–V86 (.0–.3), V87 (.0–.8), and V89.2 reported as underlying cause of death. SOURCE: National Vital Statistics System—Mortality (NVSS-M), CDC/NCHS. Obj. IVP-13.1 Decrease desired
Homicides by State, 2008–2010 NOTES: Data are for ICD-10 codes *U01-*U02, X85-Y09, Y87.1 reported as underlying cause of death and are age adjusted to the 2000 standard population. SOURCE: National Vital Statistics System—Mortality (NVSS-M), CDC/NCHS. 3.0 2.3 3.7 1.6 2.8 1.9 2.1 1.5 1.4 2.9 4.5 2.8 2.9 6.7 3.8 2.8 2.7 5.6 2.1 4.3 3.5 5.9 5.1 8.3 6.6 1.9 5.2 6.6 4.7 5.6 3.7 20.8 4.8 4.1 7.7 5.1 6.3 7.4 6.3 6.9 Per 100,000 7.4 7.5 8.1 1.4 - 3.0 6.9 9.0 10.2 3.1 - 5.5 5.8 5.6 - 8.3 12.4 4.8 8.4 – 20.8 6.7 States in shades of green have met the 2020 target of 5.5 homicides per 100,000 Obj. IVP-29 Decrease desired 1.9
Homicides, 1999–2010 NOTES: Data are for ICD-10 codes *U01-*U02, X85-Y09, Y87.1 reported as underlying cause of death and are age adjusted to the 2000 standard population. SOURCE: National Vital Statistics System—Mortality (NVSS-M), CDC/NCHS. HP2020 Baseline: 6.1 HP2020 Target: 5.5 Obj. IVP-29 Decrease desired
Homicides by Sex, 1999–2010 Total Female Male NOTES: Data are for ICD-10 codes *U01-*U02, X85-Y09, Y87.1 reported as underlying cause of death and are age adjusted to the 2000 standard population. SOURCE: National Vital Statistics System—Mortality (NVSS-M), CDC/NCHS. HP2020 Target: 5.5 Obj. IVP-29 Decrease desired
Homicides by Age Group, 1999–2010 65+ years < 18 years 45–64 years 25–44 years 18–24 years NOTES: Data are for ICD-10 codes *U01-*U02, X85-Y09, Y87.1 reported as underlying cause of death. SOURCE: National Vital Statistics System—Mortality (NVSS-M), CDC/NCHS. Obj. IVP-29 Decrease desired
Homicides by Race/Ethnicity, 1999–2010 NOTES: Data are for ICD-10 codes *U01-*U02, X85-Y09, Y87.1 reported as underlying cause of death and are age adjusted to the 2000 standard population. Multiple-race data were reported by some states; multiple-race data were bridged to the single-race categories for comparability. Persons of Hispanic origin may be of any race. SOURCE: National Vital Statistics System—Mortality (NVSS-M), CDC/NCHS. White, non-Hispanic Black, non-Hispanic Hispanic American Indian or Alaska Native HP2020 Target: 5.5 Total Asian or Pacific Islander Obj. IVP-29 Decrease desired
Self-Reports of Violence(Teen Dating Violence) • 1 in 5 female and 1 in 7 male victims of intimate partner violence (IPV)* reported that they first experienced some form of IPV between the ages of 11 and 17 * Rape, physical violence, or stalking by an intimate partner SOURCE: National Intimate Partner and Sexual Violence Survey (NISVS), CDC/NCIPC.
Injuries Treated in Emergency Departments by Event or Exposure, 2009 NOTES: I = 95% confidence interval. SOURCES: Current Population Survey (CPS), Census and DOL/BLS; National Electronic Injury Surveillance System -- Work Supplement (NEISS-WORK), CDC/NIOSH and CPSC Event or Exposure Obj. OSH-2.2 Decrease desired
Emergency Department Visits Work-related Illness and Injuries among Adolescents by Sex and Age, 2007 and 2009 NOTES: I = 95% confidence interval. Data are for emergency department treated injuries and illnesses among workers aged 15 to 19 years. SOURCES: Current Population Survey (CPS), Census and DOL/BLS; National Electronic Injury Surveillance System -- Work Supplement (NEISS-WORK), CDC/NIOSH and CPSC Obj. OSH-2.3 Decrease desired
Work-related Homicides by Sex and Race/Ethnicity, 2007 and 2010 NOTES: Asian includes Pacific Islander. The categories black and white exclude persons of Hispanic origin. Persons of Hispanic origin may be any race. SOURCE: Census of Fatal Occupational Injuries (CFOI), DOL/BLS. Race/Ethnicity Obj. OSH-5 Decrease desired
No Worksite Violence Prevention Program by Establishment Size, 2005 Size of Establishment SOURCE: Survey of Workplace Violence Prevention, DOL/BLS.