Development of a Robust 3D Visualization Tool with GUI for Flexible Data Manipulation
This project focuses on creating a powerful visualization tool equipped with a graphical user interface (GUI) that provides various display and plotting options for flexible data manipulation. Key features include input/output of data files, data cube transformation, and the capability to extract spectra and monochromatic images. The tool will support the Euro3D experimental database, enabling users to inspect existing datasets and prototype software effectively. Milestones include prototype development, testing, and final distribution, with a timeline extending to Q4-2005.

Development of a Robust 3D Visualization Tool with GUI for Flexible Data Manipulation
E N D
Presentation Transcript
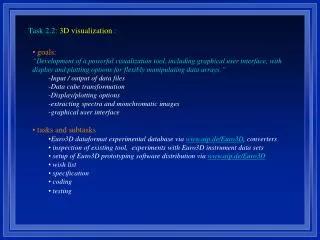
Task 2.2: 3D visualization : • goals: • “Development of a powerful visualization tool, including graphical user interface, with display and plotting options for flexibly manipulating data arrays.” • Input / output of data files • Data cube transformation • Display/plotting options • extracting spectra and monchromatic images • graphical user interface • tasks and subtasks • Euro3D dataformat experimental database via www.aip.de/Euro3D, converters • inspection of existing tool, experiments with Euro3D instrument data sets • setup of Euro3D prototyping software distribution via www.aip.de/Euro3D • wish list • specification • coding • testing
attaching people to the tasks • AIP: Thomas Becker, Martin Roth, Lise Christensen, postdoc n.n. • CAM: • DUR: • ESO: • LEI: • MAR: • MIL: • tentative timeline: • experimental phase: Q4-2002 • prototypes: Q1 … Q2-2003 • Version(s) 1.0 Q4-2004 • milestones • Data Mid-term Review, June 2004 (?) • Data Analysis Workshop, December 2004 (?) • Distribution, December 2005 (?)
coordination within the RTN sub-groups • Meeting in Potsdam, 4Q-2002 • status and availability of instruments • n.a. • observing strategy • n.a. • data reduction + analysis • publications • User Manual