Download
1 / 49
490 likes | 652 Vues
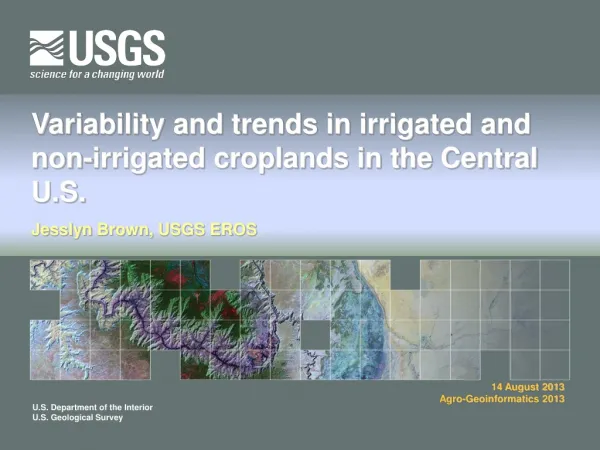
Variability and trends in irrigated and non-irrigated croplands in the Central U.S. Jesslyn Brown, USGS EROS. 14 August 2013 Agro- G eoinformatics 2013. Acknowledgments. Shahriar Pervez ( Inu tec ) Susan Maxwell ( Biomedware ) Brian Wardlow (NDMC—UNL) Karin Callahan (NDMC—UNL)

E N D
Variability and trends in irrigated and non-irrigated croplands in the Central U.S. JesslynBrown, USGS EROS 14 August 2013 Agro-Geoinformatics 2013
Acknowledgments • Shahriar Pervez (Inutec) • Susan Maxwell (Biomedware) • Brian Wardlow (NDMC—UNL) • Karin Callahan (NDMC—UNL) • Ron Zelt (USGS Nebraska Science Center) • Irrigation ground reference data providers: • California Department of Water Resources • Idaho Water Resources Board • University of North Dakota
a) b) Irrigated Agriculture in U.S. • Over 23 m hectares (233 K km2) of U.S. croplands are irrigated
2007 13.93% Source: USDA NASS
Irrigation is an agricultural practice • Agricultural intensification • Drivers for expansion in the U.S. (early to mid 20th century) • Climate uncertainty • Rising demand for farm products—rising (urban) population, rising sophistication in diet • Increasing crop yields (esp. in moisture limited environments like the American West) • Raising farm revenues • Federal policies to develop water supplies • Development of new technologies for groundwater mining and irrigation equipment Gollehon, N., Quinby, W., 2000. Irrigation in the American West: Area, water and economic activity. International Journal of Water Resources Development 16, 187-195.
Requirement for Geospatial Data on Irrigation Status (Land Use Data) • Irrigation status is a required data layer in drought monitoring • In drought monitoring, we need to separate locations that receive supplemental moisture from those that don’t • Repeatable and reliable process • Coast to coast coverage (48-state) • Moderate resolution (able to resolve median irrigated field size in U.S.) • Direct and spatially-detailed modeling strategy
Model Inputs Irrigated area statistics from USDA NASS 2002 Census of Agriculture 2002 annual peak MODIS NDVI (250 m) 2001 NLCD MODIS Irrigated Agriculture Dataset for the United States (MIrAD-US): Data and Methodology
MIrAD Model Assumptions • Irrigated crops commonly exhibit higher annual peak NDVI values than non-irrigated crops in the same local area. • The growing season peak NDVI, at any time it occurs, will vary for each crop and for each geographic region of the U.S. • The difference in peak NDVI between irrigated and non-irrigated crops will be enhanced under non-optimal precipitation conditions (e.g., drought).
MODIS 250-meter NDVI time series Annual Peak NDVI 2002 Drought
Corn & Millet Peak NDVI for Separating Irrigated and Non-irrigated Crops Beans & Corn Dry Beans Corn Corn Crop Avg. Blue line : Irrigated Red line : non-irrigated Pasture
Model Approach – Runs on aCounty Domain MODIS annual peak NDVI Masking : Peak NDVI for agricultural land only Peak NDVI rank Desc. order NLCD Area of 1st peak > USDA irr. acg. The cumulative area for peak NDVI is compared with irrigated area reported by USDA by county yes no Area of 2nd peak > USDA irr. acg. yes no Area of nth peak > USDA irr. acg. yes no Area of last peak > USDA irr. acg. yes no Loop for defining peak NDVI threshold for irrigated crops Peak NDVI cells above or equal to threshold peak NDVI are identified as irrigated All the peak NDVI cells are considered irrigated Pervez & Brown (2010) Remote Sensing 2(10) 2388-2412.
Legend Irrigated crop land Vegetation 2002 MIrAD-US
MIrAD-US Accuracy Error Matrix Regional accuracies were over 88% Accuracy at national scale is unknown
U.S. Land Use Change: Irrigation Status • In 2002, 22.4 million ha (55.3 million acres) were irrigated • In 2007, 22.9 million ha (56.6 million acres) were irrigated • Net increase of 2.3% nationally • Nationally, the proportion of harvested croplands that are irrigated has increased slightly during the last 15 years, according to the USDA Agricultural Census.
High Plains Aquifer • The HPA underlies ~450 thousand km2 (8 states: SD, WY, NE, CO, KS, OK, NM, TX) • Most intensively used aquifer in the U.S. • Ground water use primarily for irrigated agriculture • More than 60% of the aquifer lies under one state, Nebraska
Factors Causing Recent Irrigation Change in the HPA • Economic incentives • Rising commodity prices • Rising land values • Government policies (e.g. water reg.) • Demand for corn (biofuels, livestock feed, food) • Climate
Corn Soybeans Sorghum Wheat
Irrigation and 2012 Corn Yields Recent article from U.S. Department of State “The 2012 drought — the worst in more than 50 years for several U.S. states — reduced yields in many states, but less so in Nebraska. It is expected to end its 2012 summer growing season with its eighth-largest grain yield in history while drawing down its aquifer just 1 percent, Lenton said. More than 65 percent of the High Plains Aquifer, the largest in North America, lies beneath the state.” Read more: http://iipdigital.usembassy.gov/st/english/article/2012/09/20120925136551.html#ixzz296ElvEHK
From 2002 to 2007, NE land values rose 48% on average, 51% for CP Irrigated Cropland.
Nebraska Water Policy Published by the NebraskaDepartment of Natural Resources
Consequences of Irrigation Expansion • Increased crop productivity • Changing boundary layer energy and water exchange • Changes in ET • Groundwater storage • Regional climate • Water quality
Fischer, B.C. et al. Digital map of the saturated thickness of the High Plains aquifer in parts of Kansas, Nebraska, New Mexico, Oklahoma, South Dakota, Texas and Wyoming, 1996-97.
HPA Water Budget Components (Values enclosed in parantheses are given in million acre-feet per year.) Stanton, J.S., Qi, S.L., Ryter, D.W., and others, 2011, Selected approaches to estimate water-budget components of the High Plains, 1940 through 1949 and 2000 through 2009: U.S. Geological Survey Scientific Investigations Report 2011–5183, 79 p.
Water level changes in the HPA • Predevelopment to 2009 • Average water level change -14.0 ft McGuire, V.L., 2011, Water-level changes in the High Plains aquifer, predevelopment to 2009, 2007–08, and 2008–09, and change in water in storage, predevelopment to 2009: U.S. Geological Survey Scientific Investigations Report 2011–5089, 13 p.
Water level changes in the HPA • New irrigation in 2007 McGuire, V.L., 2011, Water-level changes in the High Plains aquifer, predevelopment to 2009, 2007–08, and 2008–09, and change in water in storage, predevelopment to 2009: U.S. Geological Survey Scientific Investigations Report 2011–5089, 13 p.
Summary • Regional variability in spatial change irrigated agriculture from 2002-2007 • Nationally +2.3% • HPA +8.7% • NE +16.3% • Various causes and consequences • Future monitoring will be important especially as it relates to sustainable water use (ground and surface water)
References Brown, J.F. and Pervez, M.S., Merging remote sensing data and national agricultural statistics to model change in irrigated agriculture, Agricultural Systems, in review. Pervez, M.S. and Brown, J.F., 2010, Mapping irrigated lands at 250-m scale by merging MODIS data and national agricultural statistics, Remote Sensing, 2(10), 2388-2412; doi:10.3390/rs2102388. Brown, J.F., Pervez, M.S., and Maxwell, S., 2009. Mapping irrigated lands across the United States using MODIS satellite imagery. In Remote Sensing of Global Croplands for Food Security, Eds., Thenkabail, P.S., Lyon, J.G., Biradar, C.M., and Turral, H., London, Taylor and Francis, Boca Raton, p. 177-198.
2002 and 2007 MIrAD-US can be downloaded from http://earlywarning.usgs.gov/usewem/ Access to Geospatial Data
Questions? jfbrown@usgs.gov
* * * Irrigation increased corn yields by 40-60 Bu/Acre. 2009, 2010 saw historical high yields. In drought years (*): 80 – 100 Bu/Acre.
Detrending actually shows a recent decrease in the difference between irrigated and non-irrigated yields.
Irrigated Agriculture Methodology Process is iterative, performed one county at a time for 3,114 counties.
Plans/Opportunities • 2012 is an Agricultural Census year. Updated statistics will be published late in 2013. Opportunity to produce MIrAD-US for 2012 and further land use change research. • Experiment with modeling results at the Landsat scale • Crop-specific irrigated agriculture maps
1992 11.35% Source: USDA NASS
1997 12.64% Source: USDA NASS
2002 12.74% Source: USDA NASS