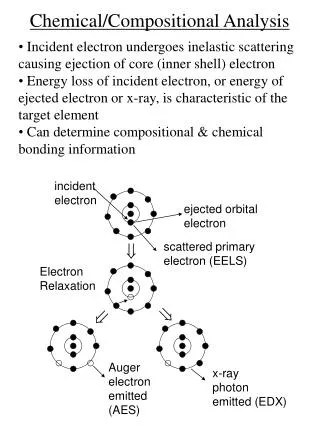
Chemical Analysis
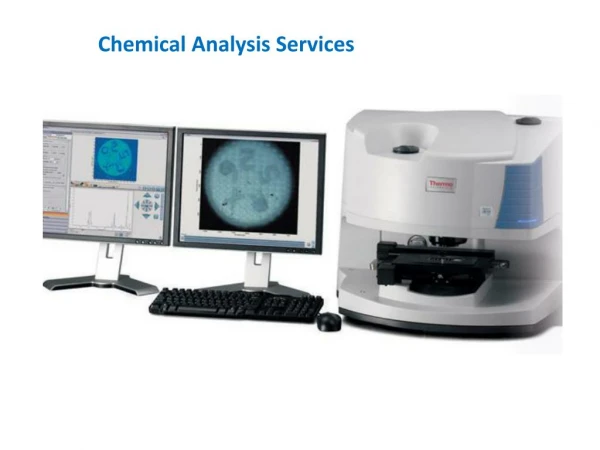
Chemical Analysis. Analytical Techniques. When chemica l evidence is collected at a crime scene, it must be run through an instrument. These instruments are designed to identify the chemical by comparing it with a database or known properties.

Chemical Analysis
E N D
Presentation Transcript
Analytical Techniques • When chemical evidence is collected at a crime scene, it must be run through an instrument. • These instruments are designed to identify the chemical by comparing it with a database or known properties. • The chemist spends their time isolating the proper chemical. • The method of isolation is different for each chemical. • Presumptive tests are done before to provide clues as to what they are looking for.
Instrumentation • The following is a small list of methods used. • These are the main ones used for drug identification, but there are many others used by toxicologists and trace. • Paper Chromatography • GC – Gas Chromatography • HPLC- High Performance Liquid Chromatography • IR – Infrared Spectroscopy • MS – Mass Spectrometry
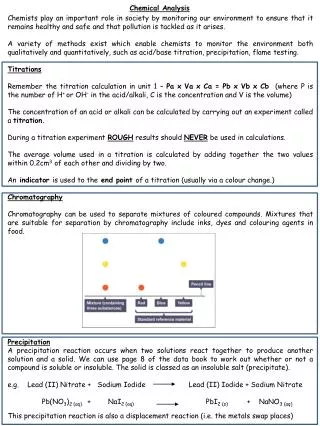
Chromatography • Chromatography is a method of separating mixtures by their attraction to a stationary phase. • The Stationary phase is chosen due to its polarity (charge distribution). • The mixture to be separated is dissolved in a substance or carried by a substance that helps it travel past the stationary phase. • The solvent is called the mobile phase. • As the solvent travels, the parts of the mixture that are more attracted to the stationary phase move slower than the parts that are less attracted.
Paper Chromatography • Can be done with drugs, inks, dyes, etc. • Mobile phase is usually an organic solvent like methanol, hexane, or carbon tetrachloride. • Stationary phase can be paper or a chromatography “plate.”
Gas Chromatography • Sample is injected into a port and mixed with a carrier gas. (could be nitrogen or helium) • Gas is heated by an oven and runs through a very long coiled silica column that contains the stationary phase. • Gas comes out the other end and the parts of the mixture go through a detector (flame or electric) which determines when they have arrived. • The retention time (how long inside the column) is used to identify the parts. • Now just used to separate the components before entering a Mass Spec or IR.
Chromatograph • Not only identifies, but by integrating under the curve you can determine quantities present in the mixture as well. • Used to do it by hand, computers are wonderful!
HPLC • A column is created with a packed stationary phase made up of tiny granules. • The mixture is dissolved in a solvent like water methanol, acetonitrile. • Instead of letting gravity pull the liquid through, it is put under high pressure anywhere from 50 – 1000 atmospheres. • Also used as a separator before passing the mixture through another detector.
IR Spectroscopy • When infrared radiation is absorbed by a molecule, it causes the bonds to bend and stretch. • This energy is absorbed by the molecule and transferred to kinetic energy, so an absorption spectrum can be created. • The instrument determined the amount of radiation that passed through. • Different bonds absorb at different wavelengths and in different amounts, so it is possible to identify each substance by its unique spectrum.
Movements Asymmetric stretching Symmetric Stretching Scissoring Rocking Twisting Wagging
Absorption Regions • Typical detectors measure the absorbance in the 1000-4000 cm-1 range (called wavenumbers) • v = 1/λ or the number of wavelengths per distance. • Wavelengths would be in the 2000 – 20000nm range. • Functional groups and double bonds have distinct locations and shapes on the spectrograph that makes them easier to pick out. • Interaction with other parts of the molecule further complicates the exactness.
Functional group absorption OH bonds tend to have large and broad absorbencies. Double bonds tend to be sharp spikes Below 1500 is called the fingerprint region and is tough to identify particulars alone.
Mass Spectroscopy • Works by breaking the molecules up into fragments of varying masses. • Fragments are ionized (carbocations) at the injection site. • Fragments pass through a quadrapole which changes in frequency causing ions to oscillate while passing through. • Different mass ions will be more or less effected. • At each resonance frequency a specific ion will pass through.
Mass Spectroscopy • The mass spectrometer changes the frequency so only one mass ion will pass through at a time. • As each ion passes through it gets detected at the other end. • Each fragment can then be determined by its mass, and the largest fragments can be use to determine the molar mass of the compound.
Other methods • Raman – a form of IR where photons of light are scattered with different energies by molecules. • FTIR – tabletop IR. • UV-Vis – measured absorbance light by different types of bonds. • NMR – nuclear magnetic resonance. Tells information about types of atoms around one nucleus.