Download
1 / 25
250 likes | 434 Vues
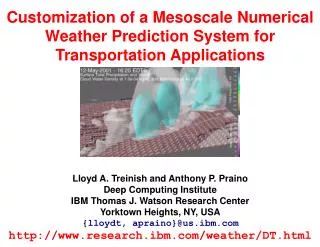
Customization of a Mesoscale Numerical Weather Prediction System for Transportation Applications Lloyd A. Treinish and Anthony P. Praino Deep Computing Institute IBM Thomas J. Watson Research Center Yorktown Heights, NY, USA {lloydt, apraino}@us.ibm.com

E N D
Customization of a Mesoscale Numerical Weather Prediction System for Transportation Applications Lloyd A. Treinish and Anthony P. Praino Deep Computing Institute IBM Thomas J. Watson Research Center Yorktown Heights, NY, USA {lloydt, apraino}@us.ibm.com http://www.research.ibm.com/weather/DT.html
Customization of a Mesoscale Numerical Weather Prediction System for Transportation Applications • Background and motivation • Architecture and implementation • Customization for transportation • Highway operations • Airport operations • Discussion, conclusions and future work
Background and Motivation • Estimated impact of weather on all types of transportation on all geographic and temporal scales in the US is ~$275B/year • Road weather ~7K lives, 800K injuries, 544M vehicle hours of delay, $42B/year • Aviation ~ $4.2B in 2000 of which $1.7B was avoidable airline delays ($3K/hour commerical, $27/passenger/hour) • Weather-sensitive transportation operations are often reactive to short-term (3 to 36 hours), local conditions (city, county, state) due to unavailability of appropriate predicted data at this scale • Mesoscale (cloud-scale) NWP has shown "promise" for years as a potential enabler of proactive decision making for both economic and societal value • Several independent but related efforts being presented at 2004 AMS (e.g., MDSS)
Background and Motivation • Despite the "promise" of cloud-scale NWP • Can business and meteorological value be demonstrated beyond physical realism? • Can a practical and usable system be implemented at reasonable cost? • Evaluate concept via a testbed implementation for New York City Deep Thunder • Operational end-to-end infrastructure and automation with focus on HPC, visualization and system integration • Forecasts to 1 km resolution for metropolitan area with 3 to 21 hours lead time • Prototype transportation applications with actual end users
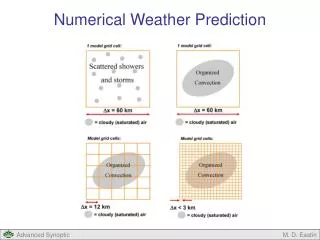
New York City Pilot 16 km 4 km 1 km • Triply nested (62 x 62 x 31) at 16, 4, 1 km (48, 12, 3 sec.) • Modelling code derived from highly modified version of non-hydrostatic RAMS • Explicit, full cloud microphysics • Typically, two 24-hour runs per day (0 and 12 UTC) • Eta-212/215 via NOAAport for lateral boundaries nudged every 3 hours • Eta-212/215 for initial conditions after isentropic analysis
Implementation and Architecture • Sufficiently fast (>10x real-time), robust, reliable and affordable • E.g., 1.5 hours (42x375MHz Power3), 2.0 hours (24x375MHz Power3) • Focus on HPC, visualization, system integration and automation • Ability to provide usable products in a timely manner • Visualization integrated into all components Post-processing and Tracking Weather Data Pre-processing Processing RS/6000 SP Synoptic Model ETA NOAAPORT Data Ingest Advanced Visualization Boundary Conditions FCST Weather Server Other Input Products Data Explorer NCEP Forecast Products Satellite Images Other NWS Data http://www... Forecast Modelling Systems Analysis Initial Conditions Custom Products for Business Applications and Traditional Weather Graphics Analysis Cloud-Scale Model Observations Data Assimilation
Visualization Component • Traditional meteorological visualization is typically driven by data for analysis -- inappropriate for transportation applications • Timely usability of cloud-scale NWP results requires • Understanding of how weather data need to be used for transportation users • Identification of user goals, which are mapped to visualization tasks • Mapping of data to visualization tasks • Users have limited control over content (targeted design) and simple interaction • Products designed in terms relevant for user • Wide range of generic capabilities needed • Line plots to 2d maps to 3d animations -- but customized • Assessment, decision support, analysis and communications • Automated (parallelized) generation of products for web dissemination • Highly interactive applications on workstations
Example Customizations for Transportation • Highway operations • Airport operations
New York State Thruway Forecasted Road Conditions • Choice of weather variable and geographic region • Color-contoured animated maps every hour
Aviation Flight Planning • Visibility, clouds and winds • Derived visibility: isosurface at 10km & profiles at airport locations • Contours (2km) of height of cloud base • Virtual wind profilers (speed and direction) at airport locations
Example Snow Storm Forecast 07 February 2003 Site- Specific Forecast
Discussion and Conclusions • An illustration of the viability of an integrated, cloud-scale, NWP-based forecasting system • New York City prototype as platform for evaluation of transportation applications • Observations by transportation users • Usable forecasts are available automatically, in a timely, regular fashion • Favorable view of the ability to provide more precise information compared to conventional sources, especially for convective events, snowfall, mixed precipitation, low visibility and high winds • Focused visualizations have been critical to effective utilization • But improved throughput and forecast quality is still needed • Future work • Better computational performance and throughput • Enhanced forecast quality and more refined transportation products • Extensions to other geographic areas and coverages • Deployment of small mesonet to aid in forecast verification and model tuning • Targeted transportation verification (e.g., travel delays, resource scheduling) • Evaluation for lake effect snow forecasts
Lake Effect Snow "Hindcast" • Record "Bald Eagle" storm: 12/24/2001 - 01/01/2002 • Longest lasting lake effect snow on record • For example, 81.6" at Buffalo airport • Little wind and not particularly cold (daytime highs in 20s oF.) • Four parts of storm (two from Lake Erie, two from Lake Ontario) • Available archived input data for most of the event • First test -- model forecast for second part of Lake Erie portion • Last round of heavy snow, Friday, December 28, 2001 • Bands moving south from southern Ontario and Niagara Peninsula • 0600 - 1200 UTC: 15.2", 1600 - 1800 UTC: 7" • Operational scenario • Pre-processing and model execution begins between ~ 0230 UTC (after input data received from the National Weather Service) • Model execution and initial post-processing completed ~ 0400 UTC • Initial products and then analysis available between 0400 and 0430 UTC
December 27 - 28, 2001 Lake Effect Snow Hindcast • Air temperature below freezing • Snow band already moved north • 18, 6 and 2 km grids (68x68) • 24-hour run initialized at 0 UTC on 12/28/01 • Small negative bias on total snow amounts • Positive bias on timing of about one hour • Lake-effect snow band resolved • Reversal of wind direction forecast Winds shift direction Lake Erie • Air temperature rises above freezing over Lake Erie • Snow band moves south from Ontario and Niagara
Backup Slides
Forecast Pre-Processing Procedural and Data Flow PDI NOAAPORT (3 x T1) Surface Observations Synoptic Model Spacecraft Imagery Radar Observations • ~750MB/day • Updated 4x/day • 5 min (1x375MHz Power3) • ~15MB/day • 2x/day • 2.5GB/day • Processed 2x/day • 30 min (4x375MHz Power3) • 4.5MB/day • Processed 8x/day • 5 min (2 GHz Xeon) Quality Control, Analysis and Processing Visualization (not yet) Visualization Visualization ~1 GB/day Analysis Evaluation Visualization • 65MB/run • 2x/day • 5 min (1x375MHz Power3) • 4x/day • 5 min (6x222MHz Power3) • 4x/day • 30 min (4x375MHz Power3) Visualization Visualization
Forecast Post-Processing Procedural & Data Flow 1 Hour Derived Analysis Files 10 Minute Browse Files • 650MB/run • 2x/day • 350MB/run • 2x/day Calculate Statistics for Analysis Files Calculate Statistics for Browse Files Node 1 Node 1 Generate Analysis Products Node 2 Generate Browse Products Node 2 Node n Node n • JPEG images (static, interactions, animations) • GIF images • MPEG animations • ~50 MB/run • Each product generated on a separate node • ~5 minutes depending on data, platform and code • JPEG images (static, interactions, animations) • GIF images • ~20 MB/run • Each product generated on a separate node • ~5 minutes depending on data, platform and code Data Process Data Flow Process Flow System
Forecast Processing Procedural and Data Flow Pre-Processing Analysis • 65MB/run • 2x/day • 5 min (1x375MHz Power3) Forecast Model • Three nests (16, 4, 1 km): 62x62x31 for 24 hours • 1.8 - 2.2 hours (28x375MHz Power3) 1 Hour Native Analysis Files 10 Minute Browse Files • 650MB/run • 2x/day • 700MB/run • 2x/day Evaluation Post-Production for Analysis Files • 2x/day • 10 min (4x375MHz Power3) • 350MB/run • 2x/day • 5 min (1x375MHz Power3) 1 Hour Derived Analysis Files
Visualization Implementation • Core implemented via Data Explorer -- an open source visualization toolkit (www.opendx.org) • Custom tools for new visualization elements and derived meteorological variables • Custom tools/packaging for new output products • Shared tools and user interface components • Simple motif widgets for indirect interaction • Direct interaction in appropriate cartographic coordinates • NO transformation or compression of data or mesh(es) • Rule-based colormap tool used during design phase • Custom export/rendering www products • Integrated with mesoscale forecasting system (Deep Thunder) • Custom I/O to balance communications, reduce latency • Custom filters for data import • Supplemented with utilities for image post-processing built upon ImageMagick (www.imagemagick.org)
Hardware Environment RS/6000 SP (AIX) 35-258 Intellistation Z-Pro (Linux) PDI NOAAport RS/6000 44P-270 (AIX) RS/6000 44P-270 (AIX) Cisco 3508 Gigabit Switch 36-130 • 4x375 MHz Power3, 3 GB RAM • GXT3000P graphics • 72 GB disk, 8mm tape • Development, testing, interactive and production visualization • 11 nodes each with 4 GB RAM, 4x375 MHz Power3 • 1 node with 16 GB RAM, 8x222 MHz Power3 • 1.32 TB RAID-5 disk array, 433 GB disk, two 80 GB DLT • Pre-processing, modelling, production visualization • 4x375 MHz Power3, 3 GB RAM • GXT3000P graphics • 72 GB disk, 4mm tape • Development, testing, interactive and production visualization • 2x2 GHz Xeon, 2.5 GB RAM • nVidia Quadro4 900XGL graphics, T221 display • 180 GB disk • Development, demos, interactive and production visualization • 800 MHz PIII, Linux • 12-foot CBand dish • 171 GB disk, 512 MB RAM • 3 satellite channels • NWS data Intellistation Z-Pro (Linux) xSeries x232 (Linux) Intellistation E-Pro (Linux) Intellistation Z-Pro (XP) Public 100Mb Ethernet • 2.5 GHz P4, 1 GB RAM • nVidia Quadro4 580XGL graphics • 120 GB disk • Demos • 2x1 GHz Xeon, 1GB RAM • FireGL4 graphics • 117 GB disk, (2) CD-RW, Jaz, Zip, scanner • Demos, interactive visualization, development • 2x1 GHz Xeon, 1.5GB RAM • 3 nVidia GeForce2 MX graphics triple display • 81 GB disk, 8mm tape • Development, interactive and production visualization • 2x1.13 GHz PIII, 1.5 GB RAM • nVidia GeForce FX5200, dual monitors • 72 GB disk • Development, NWS graphics, interactive and production visualization
President's Day Blizzard -- February 17, 2003 • An exceptionally strong (Arctic) high pressure system pushing over New England, a low pressure system developed in the Tennessee Valley and tapped into moisture from the Gulf of Mexico, and then redeveloped rapidly off the middle Atlantic coast • Periods of light snow developed as northeast winds increased to around 15 mph across the New York City area on the afternoon of February 16th • Snow became widespread and heavy, falling at rates up to 2 to 3 inches per hour that night and the next day • Heavy snow blown by northeast winds 20 to 30 mph caused near blizzard conditions throughout the area, crippling transportation • In New York City, the cost estimate for total snowfall operations was ~$20M • Widespread moderate beach erosion and minor tidal flooding occurred • The storm tracked northeast and was east of Cape Cod by early February 18 • Storm totals ranged from about 12 to 28 inches • Measured Snowfall (Inches) • JFK 25.6 Middletown 15.0 • Nyack 18.0 LGA 16.5 • C. Park 19.8 White Plains 17.0 • Upton 21.1 Bridgeport 17.0 • Yorktown 21.0 W. Milford 28.0 • Yonkers 19.0 EWR 22.1 • Islip 14.0 Danbury 19.5 Estimated Snowfall
Forecast Results February 17, 2003 • Forecast initiated with data from 0 UTC • Results available about 5 UTC, hours before heavy snow began • Good agreement in both snow totals ("dry" algorithm) and geographic distribution Liquid Equivalent Prediction "Dry" Snow Prediction "Wet" Snow Prediction
2/17/2003 Snowfall and Forecast* • Measured Snowfall (Inches) • Thornwood 26.0 Mamaroneck 18.0 Croton 14.5 • White Plains 17.0 Yorktown 21.0 Yonkers 19.0 Liquid Equivalent Prediction "Dry" Snow Prediction *Forecast initiated with data from 1900 EST on 2/16 with results available at about midnight on 2/17.
Atmospheric Stability • Identify areas for potential of severe weather • Color = K Index, convective potential based on vertical lapse rate along with amount and vertical extent of low-level moisture • Height = Lifted Index, potential instability from the surface to 500 mb • Contours = vertical wind speed • Green to yellow contours in blue "valleys" would imply regions of significant potential for severe convective activity. • Available in 1 hour intervals
Quality of Current Operational Forecasts • Very good skill at forecasting severe or unusual events • Consistently better snow forecasts for the 2002-2003 winter than what was available, coupled with far greater detail and longer lead times • Predicted ~90% of severe weather recorded in 2002 that impacted NYC airport operations • Predicted N80% of thunderstorms in 2002 within 2 hour time window • Forecasts are provided with significantly greater information compared to others • For example, timing, location and intensity vs. "chance of thunderstorms in the area" • Far longer lead time compared to weather warnings based upon current observations • Compared to a limited set of surface observations, statistical accuracy is comparable to other results • For temperature, humidity, winds, etc. • Small errors in the phase, timing or location of forecasted weather "events" (i.e., high-amplitude "features") are often manifested as significant statistical error, even when there is good skill at forecasting events • Additional benefits provided via precision and packaging