Download
1 / 9
90 likes | 197 Vues
This survey conducted by Dr. James Basham from the University of Kansas explores parent insights regarding online learning experiences for children with disabilities in STEM. Analyzing 148 parent responses, the findings reveal demographic details, educational services received, instructional methods’ usefulness, and parental involvement levels. The survey highlights challenges parents face, particularly in balancing time and supporting their children’s learning while navigating technology. This research aims to inform educators and policymakers on improving educational practices for students with disabilities.

E N D
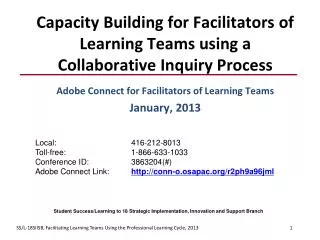
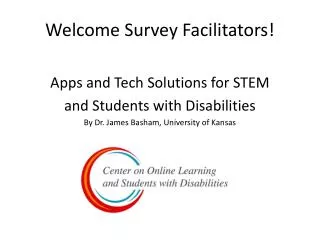
Welcome Survey Facilitators! Apps and Tech Solutions for STEM and Students with Disabilities By Dr. James Basham, University of Kansas
Parent Survey Findings: Demographics 148 Parent Responses total 46% had a child in high school 17% had a child in middle school 12% had a child in elementary 22% of respondents did NOT have a child with a disability in online learning Bringing us to 119usableresponses
Parent Findings: Demographics • Parents reported their child’s primary disability as: • Learning Disability (29%) • Autism (13%) • Other Health Impaired (13%) • No parents reported Deaf-Blindness, Deafness, or Visual Impairments as their child’s primary disability • Half of respondents’ children in fully online, half in blended environment
Parent Findings: Instruction • 40% received special ed services online • 30% received special edface to face • 20% received it both online and face to face
Parent Findings: Instructional Methods • Usefulness • Video (82%) • Audio (77%) • Games (71%) • Not Used • Social Media (39%) • Lecture (16%) • Simulation (11%) • Discussion (10% • Games (9%)
Parent Findings: Roles • Time parents spent helping their child • 3+ hours per day: • High School Parents 15% • K-8 Parents 50% • Less than 15 minutes: • High School Parents 37% • K-8 Parents 9%
Parent Findings: Roles • Areas of Influence • Child’s work time 68% • Family-school communication 63% • Assessment time, type, accommodations 51% • Less than 30% of parents selected the following areas as ones they had influence over: • Planning instruction with teacher • Extracurricular activities • Field trips • Course materials
Parent Findings: Challenges • Parents of Kindergarten – 8th grade • Not having enough time to support their child to navigate technology, learn content, and oversee their child in general • High School • More specific to their child. For example: • “He clearly doesn’t understand why he has to take this online course.” • “She receives 7 hours of therapy… This really interferes with the amount of schooling she can get done while her medication is still in her system.”
Questions & Comments? Thank you for your time! Centerononlinelearning.org