Download
1 / 3
30 likes | 130 Vues
This quiz focuses on understanding negative correlations and applying statistical concepts to a real-world scenario. Specifically, it involves plotting points that demonstrate negative correlation and analyzing the distribution of jellybeans in a bag. Given a normal distribution with a mean of 171 and a standard deviation of 12, participants will calculate the percentage of jellybean bags containing between 148 and 179 jellybeans. The exercise includes drawing a plot and finding z-scores to determine the relevant percentage using statistical software or tables.

E N D
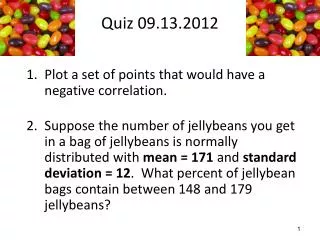
Quiz 09.13.2012 • Plot a set of points that would have a negative correlation. • Suppose the number of jellybeans you get in a bag of jellybeans is normally distributed with mean = 171 and standard deviation = 12. What percent of jellybean bags contain between 148 and 179 jellybeans?
# 1 Quiz 09.13.2012
# 2 • First draw a picture (should look something like the minitab plot below, but not in z scores scale) • The next thing we do is find the z scores. • We know2. • -1.917 • Now, either using minitab or a table, we find the percentage. • We get 0.7199 or 71.99%which is ~ 72%. • Minitab plot to the right.