Download
1 / 22
220 likes | 317 Vues
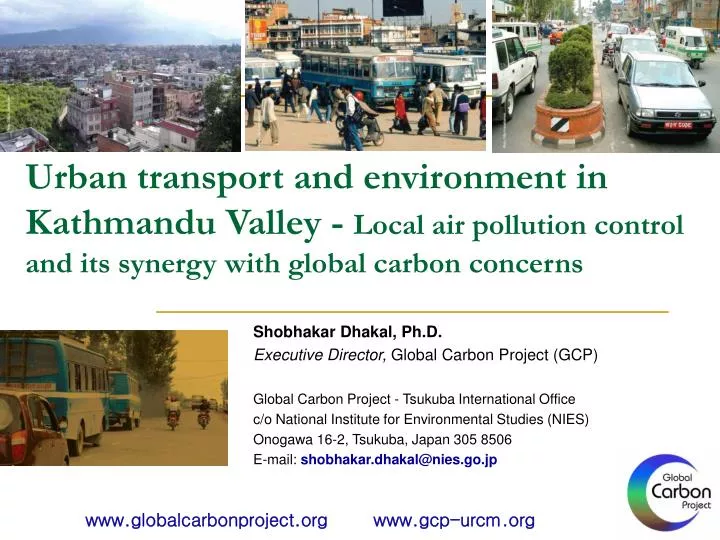
Urban transport and environment in Kathmandu Valley - Local air pollution control and its synergy with global carbon concerns. Shobhakar Dhakal, Ph.D. Executive Director, Global Carbon Project (GCP) Global Carbon Project - Tsukuba International Office

E N D
Urban transport and environment in Kathmandu Valley - Local air pollution control and its synergy with global carbon concerns Shobhakar Dhakal, Ph.D. Executive Director, Global Carbon Project (GCP) Global Carbon Project - Tsukuba International Office c/o National Institute for Environmental Studies (NIES) Onogawa 16-2, Tsukuba, Japan 305 8506 E-mail: shobhakar.dhakal@nies.go.jp www.globalcarbonproject.org www.gcp-urcm.org
Acknowledgements Ministry of Population and Environment, Nepal (now Ministry of Science, Technology and Environment)
Co-benefit approach offers opportunities toward carbon-constrained-world • Allows scaling down carbon-problem to local level by addressing local priorities • Allows local decision makers to make forward looking steps without much compromises • Gives momentum for climate concerns • How that plays out in Kathmandu’s urban transportation and air pollution context?
Questions • Among the various factors, what are the most important factors for air pollution and CO2 emissions from urban transportation? • What are the strategies for local priority issues? and • How that address the issue of carbon mitigation?
Kathmandu Valley • 1.6 million population, 666 sq km, 30% of nation’s urban population, five municipalities; PM10 is major concern 27 km Ring Road Containment policy advocated but largely failed due to non-implementation of recommended measures
Transport picture • Limited road infrastructure- 1,331 km with only 54% paved • 57% of country’s registered vehicles are concentrated in the Kathmandu Valley - 68% for cars and 64% for motorcycles • 6.8 times increase in vehicle population in last 15 years, 13% annual average growth rate, 17% for motorcycles • Operating public transport: • About 2000 buses and minibuses, about 1000 LPG and battery-operated three wheelers, about 1000 microbuses, 6-7 thousand taxies
Vehicle stock Private vehicle’s share is almost 90%
Travel demand (in pass-km)1989-2004 • 8.7 times increase in pass travel demand • Largely unchanged structure of travel demand • 57% of travel demand met by public transportation
Energy use profile, 1989-2004 - Energy use increased by 7 times - Gasoline accounts for 75% of total energy use - Buses and minibuses - are 1.4% of total vehicle population - meet 37% of travel demand - consume 13% of total energy
PM10 and CO2 emissions- 2004 • Criteria pollutant increased by four to six times based on pollutant type in 1989-2004 • Private modes are responsible for 53% of PM10 and 55% of CO2 emissions in 2004
Baseline scenario (2004-2025) • Planned and existing measures will be effectively implemneted • Phase out of 20 years old vehicles within next 5 years • 20% increase in fuel efficiency for new vehicles by 2025 • Travel demand grow by 3 times • Ownership of cars and motorcycles will double • Energy use will grow by 2.2 times
Baseline emission profile PM10 will reduce in 2010 but rebound later Reasons Rapid phase out of 20 years old vehicles Increase in fuel efficiency of new vehicles Greater penetration of EURO-I vehicles Phase out of 2 stroke three wheelers in 2004 Retirement of two stroke motorcycle by 2010 Slower expected economic growth for first few years Existing measures would not be sufficient to reduce PM10 due to rise in vehicles number
Alternate scenarios • POP: Activity control (reducing population stress in the Valley through decentralization of economic, political and administrative functions); dampening annual average pop growth to 2% from 2.54% till 2025 • PUBLIC: Transport structure control (public transport to cater 70% of travel demand; reducing similar share of private transport through car restraining policies, reducing load factor of buses and minibuses, increasing share of high occupancy public modes over low occupancy modes)
Alternate scenarios • Intensity and fuel control ELECTRIC: Higher penetration of electric vehicles by making all three wheelers to battery operated, 30% of government cars to battery operated progressively by 2025, and expanding trolley bus to ring road and existing routes so that 20% of buses would be trolley buses by 2025 EURO: Introduction of more stringent emission standards; EURO II by 2010, EURO III by 2015 accompanied by compatible fuel quality (Gasoline 500 and 150 ppm; Diesel 500 and 350 ppm)
Alternate scenarios • PACKAGE: A comprehensive set of policies without too much stressing a particular sector that makes implementation politically feasible (ASIF) • Moderate population control • Public transport share in total travel demand to 65% at the expense of private mode, high share of high occupancy public transport- 80%, buses meeting demand 10% more than minibuses, increasing comfort in buses and minibuses • All 3 Wh to be electric, 5% of total buses to be electric • EURO II by 2010, S content of Gasoline and Diesel to be each 500 ppm
Scenario evaluation criteria (from stakeholder dialogue) • Local contributions to • PM10 reduction • Congestion mitigation (vehicle population as proxy) • Energy saving • Greater use of indigenously produced energy resources (electricity in this case) • Contributions to global issues • Reductions in CO2 emission
Scenario analyses results • In short term (next five years), existing and already planned countermeasures can reduce large amount of emissions, if implemented and if in-use emission controlled in enforced strictly • Impact of EURO II would be more substantial than EURO III, EURO III will have marginal benefits • Tightening of emission standards is necessary but not sufficient: Effective for SO2, PM10 and NOX but ineffective for reducing CO2, energy use, reducing congestion and greater utilization of local energy sources
Scenario analyses • Large scale introduction of bus system will reduce large no of vehicles and save energy. However, in absence of progressive emission standards this will increase PM10 and SO2 • Impact of large scale introduction of EVs will reduce other factors nominally (but greatly increase electricity use) but will not decrease congestion • In long-run, a number of countermeasures would be necessary
Performance of various scenarios over BASE in 2025 PACKAGE Scenario is the most desirable
Conclusion • Promoting public transportation, especially with those which high occupancy modes are essential for a number of factors • A package of countermeasures are necessary which only can address various priority issues such as PM10, congestion, energy saving, greater use of electricity and CO2 • There are synergies, not the conflicts, between local and global priorities in the Kathmandu Valley
Thank you For comments and suggestions Shobhakar.dhakal@nies.go.jp