Tables
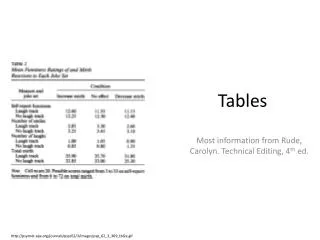
Tables. Most information from Rude, Carolyn. Technical Editing, 4 th ed. http://psycnet.apa.org/journals/psp/62/3/images/psp_62_3_369_tbl2a.gif. Tables should be easy to read and understand. Items compared are listed down the left column (stub) Points of comparison are listed across the top.

Tables
E N D
Presentation Transcript
Tables Most information from Rude, Carolyn. Technical Editing, 4th ed. http://psycnet.apa.org/journals/psp/62/3/images/psp_62_3_369_tbl2a.gif
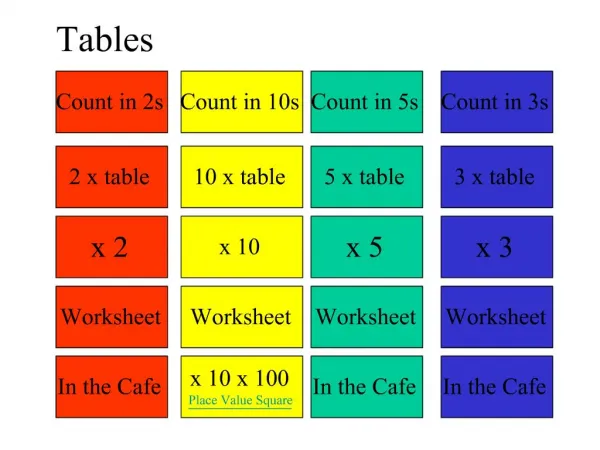
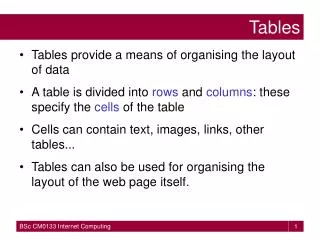
Tables should be easy to read and understand. • Items compared are listed down the left column (stub) • Points of comparison are listed across the top
Readability is important. • Avoid placing rules except when absolutely necessary • Shading across alternating lines or sections may increase readability
Alignment and consistency are key. • Columns of numbers should be aligned on the decimal • Headings should identify the represented measure • Notes may be used to clarify information 1Based on toys both constructed on-site, and ordered online 2From standing population of 236 full-time employees
Table Editing • Correctness • Consistency • Accuracy/completeness • Visual design • Title • Headings • Column headings • Alignment • Column spacing • Typeface Rude, C. (2006). Technical Editing. Pearson, p. 208.