Download
1 / 47
470 likes | 616 Vues
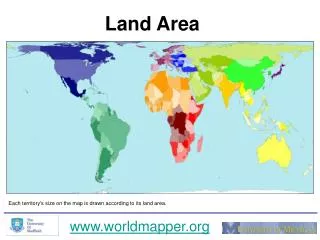
Desirable Properties for a Drought Index, or Alice’s Adventures in SWSI-Land Kelly T. Redmond Western Regional Climate Center Desert Research Institute Reno Nevada Drought Index Evaluation and Implementation in a Geospatial Framework Linked to Hydrologic Data Web Services

E N D
Desirable Properties for a Drought Index, or Alice’s Adventures in SWSI-Land Kelly T. Redmond Western Regional Climate Center Desert Research Institute Reno Nevada Drought Index Evaluation and Implementation in a Geospatial Framework Linked to Hydrologic Data Web Services Planning Workshop ESRL, Boulder CO, August 18-19, 2009
Some Drought Background Drought fundamentally involves the concept of a water budget Supply minus Demand Drought as accumulated Supply minus Demand Need status of components of the water balance Supply components Demand components Ideally, everywhere in space, at the necessary resolution Past, present, future Drought is defined by its impacts A Working Definition of Drought (very hard to avoid this approach) : Insufficient water to meet needs
Subjective / Objective Issue What does “objective” mean? An objective process is one that brings all relevant information to bear - RSP discussion There are many ground truths at once There are many droughts – simultaneously This approach is more complicated, but more useful What is the purpose of the Drought Monitor? Drought as a human construct (is there “natural” drought?) Reinforcement of this notion in presentations at 2009 Climate Diagnostics and Prediction Workshop, Lincoln NE, by Dave Stooksbury, Tom Pagano, Andrea Ray None of the foregoing decreases the need for quantitative measures of water inputs, outputs, storage (human and natural)
DROUGHTSandRAINBOWs share one common property: Every person experiences their own RAINBOW. Every person experiences their own drought.
In general, the most consequential droughts occur in the wettest portion of the year … though not always. Temperature seasonality is nearly the same everywhere:
Monthly USA Precipitation Climatologies Jan-Dec www.wrcc.dri.edu/summary/sodusa.html
Adapted from Phil Farnes, Western Snow Conference, 1995.
Oct-Mar Apr-May-June Fraction of Annual Total Precipitation, by Season July-Aug WRCC / OSU
K. Redmond, 2003. p 29-48, Water and Climate in the Western United States. U Colorado Press.
March 10, 2004 70” / 1800 mm 55” / 1400 mm 12” / 300 mm 7.5” / 170 mm
Assorted Points about Indices The “why” question : What is the purpose? Who is the audience? What do we want an index to tell them? What do they want an index to tell them? What are we expecting that people will do with the information? Indices are human constructions How do we want the index to behave? In extreme or unprecedented cases ? In unusual cases (with other factors present) ? In known past episodes ?
Assorted Points about Indices … continued A fascination with numerics Diagnosis / evaluation / testing. How to “ground truth” indexes. Which reality / realities do we wish to describe? Judging good indices on the basis of bad data. SPI (transparent) vs. Palmer (obscure) Use promotes use Homogeneity of input records
A useful series of articles about drought. August 2002 Bulletin of AMS
Desirable Properties of Climate Indices * • Detailed understanding of caveats, limitations, assumptions should not be critical to proper interpretation for indices in wide public use. Indices should not be too complex. • 2) Indices should not be overly simplified (e.g., “Colorado statewide precipitation” lumps too many things together). • 3) Indices should offer improved information over raw data values. • 4) For routine practical usage, historical time series of data must be readily available, recent values must be quickly computable, and both must be compatible (homogeneous record). • 5) It is helpful if social and economic impacts are proportional to the value of the indices.
6) Indices values should be open-ended. Unprecedented behavior yields unprecedented values. • Normalization to background climate, in non-dimensional units, greatly facilitates spatial comparisons across very different settings. • 8) Statistical properties and sensitivities should be thoroughly evaluated before operational usage. • 9) Subindices, component indices, or other spin-offs help debug or explain unusual, alarming, or otherwise interesting behavior. • Measures of placement within the historical context are invaluable and frequently requested, typically as percentiles. The goal should be a 50–100-year perspective. • From: The Depiction of Drought, Kelly Redmond, Bulletin of AMS, August 2002, 83, 1143-1147. • Adapted fromRedmond, K. T., 1991: Climate monitoring and indices, Proceedings of a Symposium on Drought Management and Planning, D. A. Wilhite, D. A. Wood, and P. A. Kay, Eds, Lincoln, NE, University of Nebraska, Lincoln, 29–33.
The Quantification of Drought: An Evaluation of Drought Indexes. Keyantash and Dracup, BAMS, 2002. Robustness Usefulness over a wide range of physical conditions. Tractability Practical computability (high level numerics, sparse data, short or incomplete records, etc). Transparency Clarity of the objective, rationale behind the index. Sophistication Conceptual soundness. May oppose trnasparency. e.g., relativity theory is not transparent or tractable, but nonetheless is a superior description. Extendability Degree to which an index may be extended across time to alternate sequences and histories. Dimensionality Composed of fundamental physical units, or, of normalized, dimensionless, probabilistic forms.
Surface Water Supply Index Considerations Purpose … Need for application specificity, to be of use What is the index supposed to correlate with? Which quantitative impact or economic measures? Are these available? And for a sufficient time? Components are as important as the whole thing Precipitation Snowpack Streamflow Reservoir storage Groundwater and soil moisture status … relevant to surface water
Surface Water Supply Index Issues Manipulated water systems have non-stationarity and/or non-normal statistics Changes through time to system infrastructure Dams raised Dams added Reservoirs kept low for repairs or other reasons Changes through time in system measurement points Gages added Gages removed Gages moved Changes through time in operational policy and practices - reservoirs Operations guidance changes emphasis Project operated for different or additional purposes Reservoir levels bounded by full and empty Preference toward keeping reservoirs full (power, recreation)
Lake Powell Storage Through July 23, 2009 As of 23 July 2009: 67 % full (capacity 24.17 MAF) Minimum: 33 % full on April 8, 2005
Lake Powell Elevation Through July 23, 2009 Water level on July 23, 2009 was 3641.76 ft, - 58 ft below full. Minimum level on April 8, 2005 was 3555 ft, -145 ft below full. Source: www.usbr.gov/uc/water/index.htl
Surface Water Supply Index Issues Different periods of record for input data yield different statistics Different SWSI components have different periods of record (POR) ex: Snow vs reservoirs vs streamgages vs precipitation For a given component (eg, snowpack) not all sites have same POR Not all past droughts may have been sampled by all components or sites Inclusion (or not) of 1950s or 1930s drought can make a difference Tails of the distributions are most affected, and of greatest interest Intercorrelation among the components (how independent is the input info?) There is always at least some correlation, and sometimes a lot Intercorrelations among components vary through the seasonal cycle For some components, significant correlation with adjoining months
Surface Water Supply Index Issuess Elephant versus mouse issue Applies to each component, but especially to reservoirs How to account for large and small components in a basin Large differences within many basins See upcoming examples When should large and small systems be normalized ? Relative versus absolute water Percentages vs percentiles Which reservoirs to include or exclude ? All reservoirs matter to somebody, otherwise why build them ? Statistics of aggregated water vs Aggregated statistics of water When should we do one, or the other ? In the general case these are different. Sometimes very different.
0.011 Capacity Total 31,058,490 MAF 0.121 0.004 0.027 0.055 0.783
Capacity Total 4,175,850 MAF 0.009 0.083 0.898 0.003 0.007
Capacity Total 1,182,954 MAF 0.090 0.014 0.015 0.701 0.099 0.070 0.011
0.169 0.018 0.056 0.004 0.753 Capacity Total 2,252,243 MAF
Surface Water Supply Index Issues How to calculate the monthly or seasonal coefficients (weights) ? What to optimize against (what criteria ?) Multiple possibilities, but nothing seems to stand out as “best” Monthly or seasonal “shocks” with step changes in coefficients Create continuously varying coefficients (Fourier series, etc) ? Use coefficients as mechanism to include/exclude components/sites Should work in all climates in the US In non-snowy climates, snow coefficients go to zero Inter-correlation issue comes up here as well as other places Predictive vs diagnostic applications Some diagnostic information is also (highly) prognostic This varies (substantially) by season
Surface Water Supply Index Issues Is there quantifiable impact or criteria information ? Much impact information does not have stationary properties Changes through time in quantification procedures Most impact information records are not very long Impact information often very short records (1-20 years) Most impact information records differ in length from physical records Water rights, allocated water Not all “available” water is available for every purpose Much water is reserved for a specific purpose A full reservoir is useless (to others) if one has no water rights A nearly empty reservoir may be ok if remainder is for the user Users are concerned only with water that is available / useful to them With SWSI, all water is the same “color”
Surface Water Supply Index Issues Index behavior Sensitivity: change in index value per unit change in input values Middle percentiles sensitive to small changes in water amounts Tail percentiles not very sensitive to large changes in amount Tails are where there is most interest ( = drought) Bounded values Percentiles bounded at 0 and 100 Good and bad implications SWSI is bounded at -4.17 and +4.17 -4.07 or -4.00 seem almost the same as -4.17 …. not! Nothing intuitive about these values, like 0 and 100 No unprecedented values allowed Is this a desirable property ?
Surface Water Supply Index Issues Practical and logistical issues All data must be available in a timely manner Generalized access to water information Has to be on a publicly accessible system Water data often hard to get Especially reservoir time series Double-especially private reservoir time series Metadata often in poor shape, scattered, not quality controlled Need the actual data time series, not just the statistics Infilling of missing segments Quality control to produce a working copy operational data base Automated ingest for nearly everything What is the updating cycle? Some data only available manually (weakest link problems)
Surface Water Supply Index Issues Migrate from monthly to daily ? A lot can change in a month, and right after a new month starts Some data readily available daily, others hard to obtain even monthly Social Issues Neutral information broker is needed Who calculates it ? Is this even a relevant question ? All components available for a user to create their own SWSI SWSI versus “BWI” Why leave out groundwater ? BWI … Basin Water Index Recommended by participants in 2002 NRCS workshop SWSI comes from setting groundwater coefficient to zero Can have many flavors of indices by setting coefficients to zero
Surface Water Supply Index Issues Testing and validation Drought trigger (SWSI or any other) behavior in past droughts Case studies of past drought episodes As earlier droughts evolved, which information was superior ? Are there certain situations where SWSI is the more useful index ? Is one particular component driving a low SWSI value ? Occam’s Razor Most drought indicators are correlated Simpler approach often almost as good (SPI versus Palmer example) Might we be letting the perfect be the enemy of the good ? Too simple vs Too complicated Presentation Need creative ways to show all components at once
The Quantification of Drought: An Evaluation of Drought Indexes. Keyantash and Dracup, BAMS, 2002. Robustness Usefulness over a wide range of physical conditions. Tractability Practical computability (high level numerics, sparse data, short or incomplete records, etc). Transparency Clarity of the objective, rationale behind the index. Sophistication Conceptual soundness. May oppose trnasparency. e.g., relativity theory is not transparent or tractable, but nonetheless is a superior description. Extendability Degree to which an index may be extended across time to alternate sequences and histories. Dimensionality Composed of fundamental physical units, or, of normalized, dimensionless, probabilistic forms.
The Standardized Precipitation Index. McKee, Doesken, Kleist, 1995. From Experience, FiveCommonly Asked Questions: How much precipitation have we had? Absolute Amount in units. How much more or less than usual is this? Absolute Departure in units. What percent of average is this? Relative Departure in Percentage units. How often does this happen? Historical context. Is there some kind of description comparable across space? “Standard” Plus We can be in different situations in different time scales.
Rationale for use of Standardized Precipitation Index Straightforward interpretation Depends only on precipitation Similar to Palmer Index in some ways Correlates well and best at 8-12 month time scales But, disagreement is not necessarily undesirable … they measure different things Several useful associated quantities Basic time step is now monthly Consideration of shorter, sub-monthly, time scales Precipitation data easiest to get
R. Seager, M.F. Ting, I.M. Held, Y. Kushnir, J. Lu, G. Vecchi, H.-P. Huang, N. Harnik, A. Leetmaa, N.-C. Lau, C. Li, J. Velez, N. Naik, 2007. Model Projections of an Imminent Transition to a More Arid Climate in Southwestern North America. Science, DOI: 10.1126/science.1139601
Seager et al, 2007. Average of 19 climate models. Figure by Naomi Naik. www.ldeo.columbia.edu/res/div/ocp/drought/science.shtml