Download

1 / 36
360 likes | 885 Vues
BOND MARKETS, PRICING AND STRUCTURES. Bonds. Bonds as IOU’s with coupon and principal payments. Recall ealy slide of 2015 estimated size of global financial assets. Of the $300 Tr , 30% are equities, the remaining 70% is debt (sovereign, financial, non-financial, corporate, loans).

E N D
Bonds • Bonds as IOU’s with coupon and principal payments. • Recall ealy slide of 2015 estimated size of global financial assets. Of the $300 Tr, 30% are equities, the remaining 70% is debt (sovereign, financial, non-financial, corporate, loans). • In the US, a conservative estimate is Treasuries ($ 15T), Municipals ($4T), Agency ($2T), Corporates ($4T), Mortgages ($4T), Asset Backed ($1.5T). The munis alone have over 50K issues with tax-exempt status. • For India, see CRISIL yearbook.
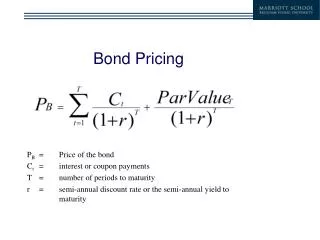
BOND BASICS 1 2 3 ……. 20 100 100 100 ……. 100 1000 COUPONS Usually semi-annual. We assume annual. • FACE VALUE - we’ll assume $1000 • PRICE = PV OF ALL CASH FLOWS DISCOUNTED AT YIELD • CURRENT YIELD = Coupon/Price (approx) vs. Yield to Mat. SUPPOSE ABOVE BOND HAS A MARKET PRICE OF $1091.285. Q: WHAT IS ITS YIELD TO MATURITY (YTM) ? • YTM = The rate at which the PV of cash flows equals bond price. • Treat as PV/FV Problem: FV = 1000, PMT = 100, PV = 1091.285, N = 20 YRS, SOLVE FOR INTEREST RATE AS 9%. YIELD = ?
BOND BASICS (Cont’d) 1 2 3 80 80 80 1000 PRICE = ? REVERSE EXAMPLE: TO PRICE A BOND, GIVEN ITS YIELD GIVEN YTM = YIELD = 12% PRICE = 80 * PVIFA (3, 12%) + 1000 * PVIF (3, 12%) = 192.15 + 711.78 = 903.93 (DISCOUNT BOND)
BOND BASICS (Cont’d) SO, YIELD > COUPON PRICE < PAR (discount bond) YIELD < COUPON PRICE > PAR (premium bond) YIELD = COUPON PRICE = PAR (par bond) IF, COUPONS ARE SEMI-ANNUAL, THEN DOUBLE THE MATURITY; HALVE THE YTM AND COUPON RATES
BOND BASICS (Cont’d) • Price FOR “PLAIN VANILLA” BONDS, maturity and coupon are fixed. • At the time of issue, bonds are priced at par with coupons near the prevailing yield on similar bonds. The one exception is OID (original issue discount) bonds. • After the issue, as rates change, yields on individual bonds change (not exactly) and the bond becomes a discount or a premium bond. • Rate changes don’t really matter if your objective is to buy the bond and hold till maturity, but there is still concern about default risk. premium Mat. (par)1000 • time discount With time, prices of all bonds move towards par. Path may be jagged because the interest rates change.
REALIZED COMPOUND YIELDS Calculate it for the 3-year bond assuming a 5% reinvestment rate. 1 2 3 Recall that YTM implies coupons re-invested in the bond at its yield. Reality is that coupons may be re-invested (if at all) at a different rate than the YTM. So, the rate of return REALIZED is different and is called REALIZED COMPOUND YIELD (RCY). Price=903.93 80 80 80 1000 80 * FVIF (2,5%)= 88.2 80 (1.05) = 84.0 903.93 * FVIF (3, X%) = 1252.2 X = 11.47% IS RCY
BOND PRICING: BOND PRICE CHANGES WITH TIME-1 REVISIT THE 3-YEAR 12% DISCOUNT BOND ABOVE. FIRST ASSUME THAT TIME PASSES AND RATES STAY THE SAME. YTM STAYS AT 12% PRICE EVEN THOUGH YTM STAYS THE SAME. Q: RATE OF RETURN IF YOU BUY BOND AT 903.93 AND SELL AFTER ONE YEAR AT 932.90 ? (932.90 + 80 – 903.93)/903.93 = 12% (IS THE YIELD) Q: IS ABOVE TRUE FOR A PREMIUM BOND TOO? (I.E DOES ITS PRICE INCREASE ?) NO Q: IS ITS RETURN STILL 12% ? YES 1 2 3 Price=903.93 80 80 80 1000 P=? = 80 PVIFA(2,12%) * 1000 PVIF (2,12%) = 932.39
WHAT HAPPENS TO BOND’S PRICE AS RATES CHANGE ? SAY, YTM FALLS TO 8% IN 1 YEAR BOND BECOMES A PAR BOND, AFTER ONE YEAR. Q: RATE OF RETURN IF SELL AT THIS TIME? (1000 + 80 – 903.93)/903.93 = 19.48% OLD BUYER EARNED 19.48%, NEW BUYERS GET 8%. AVERAGE OVER 3 YEARS IS 12% (GEOMETRIC) Q: WHAT ABOUT AFTER ONE MORE YEAR? a)Say yields stay the same ? price is the same too. b) Say yields increase ? price declines. 1 2 3 Price=903.93 80 80 80 1000 12% 8% P=? = 80 PVIFA(2,8%) * 1000 PVIF (2,8%) = 1000
REAL WORLD BOND PRICING. • Start with a set of zero-coupon Treasuries, for which the following prices are quoted • Time to Mat Price Inferred Spot RateDiscount factor • 1-year 909.09 10% 0.90909 • 2-year 811.62 11% 0.81162 • 3-year 711.78 12% 0.71178 • Discount factors are just the PV of a $1 face value bond. In reality, the spot rates above are “inferred” by traders from the prices for pure discount bonds of various maturities that they observe. So, the following are equivalent statements: • a) 1-year zeros yield 10% • b) The 1-year spot rate is 10% • c) To discount cash flows in 1 year, use 10% • d) The price of a 1-year zero = 1000/(1.10)1 = 909.09 • What happens when the Fed adjusts short-term rates? Do the rates on all maturity adjust equally (parallel shift)?. During the last few rate hikes, the long maturity yield did not move as much.
BOND PRICE DYNAMICS Prices at BOND % chg YTM=12 YTM=10 YTM=8 % chg ___________________________________________________________ (1) (2) (3) (4) (5) (6) 10-yr, 12% -11.18% 1000.00 1125.85 1268.41 12.66% 15-yr, 12% -13.20% 1000.00 1152.13 1342.34 16.51% 20-yr, 12% -14.55% 1000.00 1170.23 1392.67 19.01% 20-yr, 4% -17.72% 402.48 489.14 607.22 24.14% 20-yr, 0% -30.22% 103.70 148.60 214.50 44.35% ___________________________________________________________ BOND PRICE DYNAMICS FROM COL(2) FOR THE SAME COUPON, LONGER MATURITY BONDS HAVE GREATER PRICE SENSITIVITY TO YIELD CHANGES (1st 3 BONDS) DOWN COL(2), FOR THE SAME MATURITY, LOW COUPON BONDS GREATER PRICE SENSITIVITY TO YIELD CHANGES (LAST 3). SAME FOR COLUMN (6)
Duration and convexity Above example looks at the implications of time to maturity and coupon separately. They are combined into a weighted average measure called DURATION. A simple relation is: % change in price is roughly equally to – Duration * change in % yield. You can think of duration for a bond, like a beta for a stock. The change in market yields is lke systematic risk and duration tells you how sensitive the bond’s price is to that systematic factor. (Also tie to payback period). The relationship is approximate is because prices and yields are related in a non-linear way, (think bond pricing formula), and we are “linearizing.” The error in this measure is known as convexity.
HORIZON ANALYSIS Consider 3 bonds A: 5-year maturity, 6% coupon, YTM = 9% B; 10-year maturity, 8% coupon, YTM = 9% C; 15-year maturity, 4% coupon, YTM = 9% You have a 5 year investment horizon, and if you buy longer bonds, they will be sold at the prevailing market price. All coupons will be reinvested. Forecasts of rates are 7% for years 1-5 AND 8% for yrs 6-15. WHICH BOND TO CHOOSE? FIRST, FIND THE 5-YEAR RATE OF RETURN FOR EACH BOND OVER THE 5 YEARS HELD, BY: Pricing each bond at purchase; b) pricing each bond at sale; c) reinvesting coupons. All according to the forecasted rates.
HORIZON ANALYSIS-Continued. YTM Price FV Bonds price Terminal HPR (coupons) (in 5 yrs) value A 9% 883.31 345.04 a 1000.00 1345.04 8.77% B 9% 935.82 460.06 b 1000.00 c 1460.06 9.30% C 9% 596.97 230.03 731.60 d 961.63 10.00% PICK BOND C. WAS THIS OBVIOUS FROM INSPECTING THE DIFFERENT RATES? a For A, FV (coupons) are 60 * FVIFA (5, 7%) = 345.04 b For B, FV (coupons) are 80 * FVIFA (5, 7%) = 460.06 c For B, Price = par as prevailing yield is 8% = coupon d For C, Price = 40*PVIFA (10, 8%) + 1000*PVIF (10, 8%)=$ 731.60
ACCRUED INTEREST • Bond prices are quoted with a mark-up, including commissions which vary by company. Done this way because of low liquidity. Bond prices are quoted net of accrued interest (flat prices)? • When bonds are purchased in between coupon payments, the buyer has to pay the bond seller her part of the coupon which the buyer will receive after purchase. Accrued interest is this interest payable on the bond from the date of the prior coupon. • US T-bonds pay coupons semi-annually. The Treasury provides a half-year calendar. For Feb/Aug cycles, the half-year is 181 days (regular) and 182 days for a leap year. For March/September cycles, half-year is 184 days.16+30+31+30+31+31+15). So, if you have a March cycle bond paying an 8.875% coupon which is purchased 109 days after the last payment, the accrued interest per $100 bond is: = (109/184) * (0.50) * (0.08875) * 100 = 2.63
OPTION FEATURES AND BONDS • CALLABLE: Issuer can call & reissue if coupon > market yield (like a refi). These bonds may be priced based upon call date not maturity date if the chance of issuer exercise is high. • AND PUTTABLE (option with bondholder. If coupon < market yield, put the bond, get the principal and reinvest at prevailing market yields (i.e shorten bond’s life). • CONVERTIBLE (say $1000 bond converts to 40 shares of stock). Conversion ratio is 1:40, If stock at $30, there is value to conversion, price is $1,200, Conversion premium is $200. • FLOATING RATE BONDS Here the coupon increases with interest rates. The floating rate may be indexed to the Fed funds rate/T-bill rate/prime rate/LIBOR or other. At times the rate is capped at some maximum. Frequency of reset could be daily/weekly/monthly/semi-annual/annual. At any payment date, the price of a floating rate bond is its par value.
OPTION FEATURES AND BONDS (Cont’d) • AUCTION-RATE SECURITIES are often muni bonds which are long-term securities but the interest rate is set via a dutch auction, typically 7, 28 or 35 days. Many failed recently as there were few buyers and the banks refused to take up the excess supply! Port Authority ended up with a 20% effective rate !! • INVERSE FLOATERS A plain vanilla bond may be repackaged as a floater and an inverse floater. A 4% coupon bond is broken into a floater at LIBOR + 1% and an inverse floater at (3% – LIBOR). So, if rates rise, prices fall and coupon income falls too! Such bonds are hyper-sensitive to rate changes. • INDEXED BONDS: TIPS Issued with 3, 5 and 10 year maturities. Suppose a 10-year TIP pays 6% coupon and inflation is 2% for the past year. Then the face value is adjusted by 2% to 1020 and a 6% coupon is paid on it. Can think of the interest rate on these bonds as a risk-free real rate. When do you buy them ? When inflation expectations are low.
OPTION FEATURES AND BONDS (Cont’d) • P-I-K (PAYMENT IN KIND) BONDS Can pay interest in cash or in other bonds. In some versions, interest is added on to the principal for later payment. • MORTGAGES (not much in your book, but we’ve talked enough). • STRIPS Coupon bearing Treasury bonds are stripped into a series of “stripped” bonds of various maturities. • I-O and P-O STRIPS Here a mortgage bond is separated into an interest component and a principal component. The interest component is high in the early years and the principal component is high in the later years. Structured finance and securitizations refer to more complicated re-distributions of the payoffs rather than just principal and interest. These are leveraged and largely responsible for the credit crunch we are STILL in!
TAXES AND OID BONDS • Suppose a 30 year zero is issued when rates were 10% per year. The price of the bond is 1000/(1.1)30 = $57.31 and it is issued at a $942.69 discount from par. After 1 year, the IRS imputes an interest rate of 10% and correspondingly imputes the price of the bond as 1000/(1.1)29 = 63.04. The difference 63.04 – 57.31 or 5.73 is taxed as ordinary income. • However, over the year as rates change, the actual market price of the bond may be different from 63.04. IF the bond is sold, the difference between the market price and the IRS imputed bond price is treated as a capital gain or loss.
CORPORATES AND DEFAULT RISK Bond indenture is a contract between issuer and holder, essentially a set of restrictions on the issuer, such as: • Sinking funds—since eventual principal payments can create cash • crisis, bonds may be repurchased periodically instead. • Subordination clauses—to restrict additional borrowing • Covenants on dividend—cannot payoff to stockholders • Collateral—mortgages, securities, equipment, none. Default risk: Primary source is bond ratings agencies (Moodys. S&P or Fitch). Ratings are typically derived from examination of financial ratios: interest coverage, leverage, liquidity, profitability. Typically, lowest investment grade bonds are those deemed to have adequate capacity to pay interest and repay principal.
CORPORATES AND DEFAULT RISK (Cont’d) Are ratings changes anticipated by the bond market? Generally, prices tend to move in advance of agency action. * The ratings from Aa to Ca by Moody’s may be modified by the addition of a 1, 2 or 3 to show relative standing within the category. ** The ratings from AA to CC by Standard & Poor’s and Fitch Ratings may be modified by the addition of a plus or minus sign to show relative standing within the category.
CORPORATES AND DEFAULT RISK (Cont’d) HIGH YIELD BONDS • Origin with Drexel and Milken. About 25% are fallen angels, another 25% were issued below investment grade, about 50% from LBO restructuring. • Credit quality appears higher these days. But a lot of the credit issues have moved to the credit derivatives market (CDO’s).
BOND SPREADS Fixed income market participants often make comparisons using spreads. • The treasury yield spread (compares short vs long maturities). • The NOB spread compares the spread between T-notes and bonds. • The TED spread compares T-bills with Eurodollars. • The High-yield spread compares junk bond yields with AAA corporates. OPTION ADJUSTED SPREADS (OAS). Because of the various option features embedded in bonds, it has become common to think in terms of an option adjusted spread. For instance suppose a callable corporate bond trades at a spread of 100 basis points over Treasuries. If 60 of those are attributable to the risk differences of the bond over the Treasury and the 40 is attributable to the option feature. The OAS is 60 basis points.
YIELD CURVES (Play with the dynamic YC in stockcharts.com/charts/)
YIELD CURVES (Cont’d) • Yield curves represent the interest rates available for investments of different maturities, but with similar risks. Strictly speaking, the term structure of rates refers to the relationship between default-free zero coupon securities and their maturities. But can draw yield curves for other risk classes as well. • Yield curves are rarely flat for all maturities as the YTM implies. • Yields are not known but are inferred from prices. • Sometimes prices are known only for bonds of some maturities and have to be inferred.
SLOPE OF THE YIELD CURVE A steep yield curve often precedes an economic upturn. A flat YC curve often precedes an economic slowdown (transitory) An inverted yield curve often precedes a recession
THEORIES ABOUT THE SHAPE OF THE YC ARE: • THE PURE EXPECTATIONS HYPOTHESIS • Forward rates = Expected Future Spot Rates • Most investors are short-term, see risk in lending long-term. And require a premium for giving up liquidity Forward rates HIGHER than expected future short rates Upsloped yield curve (always) THIS IS THE LIQUIDITY PREFERENCE HYPOTHESIS • Financial institutions have a preference for different maturities because of the nature of their business (Life insurers want long maturities, property insurers want shorter..) THIS IS MARKET SEGMENTATION
STRATEGIES AROUND THE YIELD CURVE ARE: • 1) bullet: concentrate on one maturity • 2) barbell: concentrate on 2 extremes (very short + very long) • 3) ladder: equal money across all maturities
STRATEGIES AROUND THE YIELD CURVE ARE: (Cont’d) Riding the yield curve (very short-term) When YC’s are upward sloping, as a bond approaches maturity, it is valued at lower yields and higher prices, so hold and sell before maturity to pick up some return. E.G CURRENT Yield curve is 1-yr bonds earn 6%, 2-year bonds earn 7% per year. EXPECT YIELD CURVE TO STAY THE SAME WITH TIME, MAT YIELDS 7% 7% INTUITION a) BUY 1-YR BOND => GET 6% b) BUY 2-YR BOND AND SELL AFTER ONE YEAR (YIELD CURVE SAME) 873.44 1000 6% 943.40 1000 NOTE THAT “expecting the YC to stay the same” is one kind of forecast of future interest rates. YC same Next year’s spot rate will be 6% (like this year). (1-yr 6%, 2-yr 7%). Expected spot rate will drop. This expectation is different from what is implied in the forward rate. (forward rate is 8%). RETURN = (943.40 – 873.44)/873.44 = 8%
CREDIT INSTRUMENTS: A) CREDIT-LINKED NOTE: A bank holds a risky GM 5-year 4.5% par bond. To protect itself from default risk, the bank offers another 5-year note to investors, paying 5%. These cash flows are linked to the credit risk of the GM bond as below. If GM does not default—Note holders get 5% and par back. If GM defaults—note holders get the GM bond and will have to recover cash flows from them. i) the 0.5% higher interest rate paid on the note is like a premium for protection against default. ii) GM may not know this is happening (relationship issues) and this is off-balance sheet. iii) The CLN is “funded” in that note holders have paid and will get a refund (of the entire amount or as a defaulted GM bond back. This money earns interest for the bank holding it. iv) The underlying (called a reference asset) does not have to be a bond, but could be any of the building blocks above).
CREDIT INSTRUMENTS: B) Credit Default Swap (CDS) Same story as above, except that there is no “note” created. But only a periodic payment (of 0.5% of a notional principal) is made instead. This is the CDS premium (sometimes called a credit spread, sometimes reported as b.p over LIBOR….). Think of it as an insurance premium (like a put option on the underlying bond). Big difference is that unlike home owner’s insurance anyone can buy this “insurance” against the default of another’s cash flows. The bank making the payment is BUYING protection (insurance). AIG who receives the periodic payment is SELLING protection. The bank is selling GM credit risk. AIG is buying it. i) the CDS is UNFUNDED in that AIG promises to pay par in the event of default (even if it’s value is way below par) at that time. This can be done with “cash” or “physical” settlement. Cash implies that the difference between the notional amount and current market value is paid by AIG. Physical implies that the bond is submitted and the face value is paid by AIG. The protection is on principal, not on coupons. ii) Note the difference from your typical insurance premium. The CDS trades => as perceptions of default risk change, the insurance premium changes and you trade it for a profit or loss. As another example, suppose you target a company with a credit line that you expect will be drawn down as bad times approach. You buy protection before that (when it is cheap) and sell after (when it is expensive).
CREDIT DEFAULT SWAPS - 2 iii) Legally, there is a notion of “insurable interest.” For example, with life insurance, you can’t wander around hospitals looking for someone who won’t make it and buying insurance contracts on their lives! And cashing it as their condition deteriorates. But with credit markets you can! In 2001, the CFTC decided NOT to regulate this market. In 2008, state insurance commissioners were looking reverse. iv) The ability to trade also means that “netting” of positions is fairly common, e.g. you sell protection to Lehmann but buy it from AIG (possibly different prices, different times, different notional amounts). v) All this is standardized by ISDA—what constitutes a credit event, what period does the agreement apply (most commonly 5-years). vi) effectively a synthetic short sale (in this case short-sale of a bond). If you buy protection on a par bond you don’t own, and it defaults, you purchase that bond at market (low) and get par back! viii) is a clean measure of default risk and has had an active market. IX) They are back since 2013, Now called Credit Risk Transfer Securities (Some skin in the game).
VARIATIONS • If you can trade a bond’s default risk, why not that of a loan. Loan CDS market started in 2005. • If you can trade the default risk in a bond or a loan, why not the default risk of a portfolio of them! Nth-to-default basket swaps. • If I have a portfolio of risky assets that are uncorrelated, then default of one does not mean default of another, so the basket CDS premium is lower than the sum of the individual CDS premiums. So protection buyer is happy. Also, since more than one default is likely the basket premium will be higher than the premium for the most risky component of the basket so the protection seller is happy. • First-to-default means protection buyer gets paid when the first piece of the basket defaults. • Third-to-default => protection buyer gets paid when the 3rd default in the basket is triggered. • If you can trade a portfolio of them, why not build an index and trade the index directly ! Enter CDX.NA.IG.5yr. • If you can trade CDS of bonds, loans and indexes, why can’t you create CDS of MBS or ABS or sub-prime ABS? Enter ABX-HE-A 06-1.
Senior : 750 @ 5.5% Interest = $ 41.25 Senior : 750 @ 5.5% Interest = $ 41.25 Collateral $1000 face at 7%. (1000 * 0.07=70) Interest = $70, divided: 2.75 + 41.25 + 18 + 8 Collateral $ 8=980 face at 7%. (980*0.07=68.6) Interest = $68.6 divided: 2.75 + 41.25 + 18 + 6.6 Mezzanine: 225@8% Interest = $ 18.00 Mezzanine: 225@8% Interest = $ 18.00 Equity: 25 Interest = $ 8.00 Equity: 25 Interest = $ 6.60 Principal AT RISK! • Collateralized Debt Obligations- Cash CDO • Assume no default, fees of $ 2.75 per 1000. ii) 4 % default, 50% recovery, one time (0.04*0.5*1000 = $20 gone, $ 980 remains).
Senior : 750 @ 5% Interest = $ 41.25 Collateral $ 900 face at 7%. (900 * 0.07 = 63) Interest = $ 63, divided: 2.75 + 41.25 + 18 + 8 Mezzanine: 225@8% Interest = $ 18.00 Principal AT RISK! Equity: 25 Interest = $ 1.00Principal GONE ! iii) 4% default, 50% recovery, each of 5 years (0.04*50*5*1000 gone) Synthetic CDO’s. In the above example the loans/mortgages/MBS provided the cash flow that the CDO’s redistribute. Why can you not get the cash flow directly from selling CDS protection and then distribute it to the tranches (the BISTRO structure, JP Morgan, 1997). They marketed it very successfully and sold the template to everyone.