Download
1 / 7
70 likes | 187 Vues
Explore the distribution of sequences in genomes across domain superfamily clusters, Pfam superfamilies, and unique families. Learn about homology modeling methods and functional predictions within large superfamily clusters. Utilize electrostatic potential analysis for assessing function diversity.

E N D
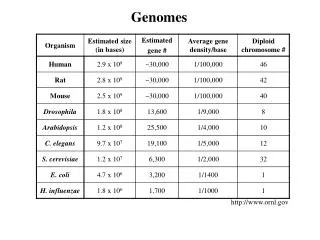
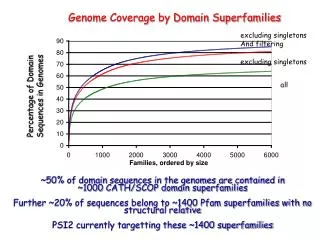
Genome Coverage by Domain Superfamilies excluding singletons And filtering excluding singletons all Percentage of Domain Sequences in Genomes ~50% of domain sequences in the genomes are contained in ~1000 CATH/SCOP domain superfamilies Further ~20% of sequences belong to ~1400 Pfam superfamilies with no structural relative PSI2 currently targetting these ~1400 superfamilies
Pfam superfamily close sequence family (30%) ‘unique family’ PSI2 targetting ~1400 LARGE superfamilies with no close structural relative
Targetting ~1400 Pfam superfamilies but these contain tens of thousand of subfamilies All sequence families Near/distant PDB relative no PDB relative Unique families ordered by size
Pfam superfamily close sequence family (30%) ‘unique family’ functional group target ~1400 LARGE Pfam superfamilies common with no structural relative target clusters of families predicted to have different functions Gene3D annotations: COG, GO, EC, DIP, BIND, Y2H, Microarray data, phylogenetic profiles
Methods like ProSa and GA341 can identify reasonable models at low sequence identities. Comparison of models built by different methods may help in identifying reliable regions Model quality v sequence identity for 78,545 structural genomics homology models, built by Modeller 8v1, assessed using ProSa II
In combination with analysis of other features e.g. domain context, homology models may help in suggesting functional subgroups within a superfamily Dissimilarity in electrostatic potential as an indicator of dissimilarity in function of PH domains. Blomberg et al. (1999) Classification of Protein Sequences by Homology Modeling and Quantitative Analysis of Electrostatic Similarity. Proteins 37:379-387 Electrostatic potential tends to be conserved to relatively low sequence identity between target and template. Chakravarty et al. (2005) Accuracy of structure-derived properties in simple comparative models of protein structures. Nucleic Acids Res. 33:244-259 Human exo84 signalling complex Human pleckstrin
GeMMA http://www.biochem.ucl.ac.uk/~dlee/GeMMA • Currently ~ 80,000 • models built by Modeller • Update requires ~ 1 • month every 6 months • Modelling alignments • from SAM-T99 HMMs • Residue conservation • calculated by Scorecons • Electrostatic potential • calculated by APBS • Model quality assessed by • ProSa 2003 and GA341