Understanding Increasing, Decreasing, and Constant Functions in Graphs
320 likes | 437 Vues
This section delves into the analysis of functions, focusing on identifying intervals where they are increasing, decreasing, or constant using x-coordinates. It includes practical examples and discussions on relative maxima and minima, exploring their significance as local points on graphs. Additionally, the content covers even and odd functions, symmetry, and piecewise functions, providing interpretation and graphing techniques. Learn how to simplify expressions and understand the difference quotients, essential for mastering function behavior.

Understanding Increasing, Decreasing, and Constant Functions in Graphs
E N D
Presentation Transcript
Increasing and Decreasing Functions
The open intervals describing where functions increase, decrease, or are constant, use x-coordinates and not the y-coordinates.
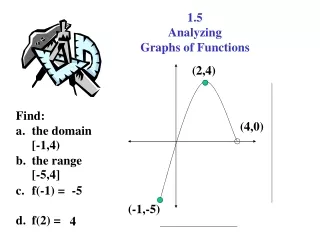
Find where the graph is increasing? Where is it decreasing? Where is it constant? Example
Example Find where the graph is increasing? Where is it decreasing? Where is it constant?
Example Find where the graph is increasing? Where is it decreasing? Where is it constant?
Relative Maxima And Relative Minima
Where are the relative minimums? Where are the relative maximums? Why are the maximums and minimums called relative or local? Example
Even and Odd Functions and Symmetry
Example Is this an even or odd function?
Example Is this an even or odd function?
Example Is this an even or odd function?
Example Find and interpret each of the following.
Example Graph the following piecewise function.
Functions and Difference Quotients
Example Find and simplify the expressions if
Example Find and simplify the expressions if
Example Find and simplify the expressions if
(a) (b) (c) (d)
(a) (b) (c) (d)
(a) (b) (c) (d)