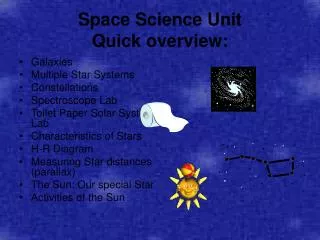
Space Science Unit Quick overview:
Space Science Unit Quick overview: Galaxies Multiple Star Systems Constellations Spectroscope Lab Toilet Paper Solar System Lab Characteristics of Stars H-R Diagram Measuring Star distances (parallax) The Sun: Our special Star Activities of the Sun Introduction Activity

Space Science Unit Quick overview:
E N D
Presentation Transcript
Space Science UnitQuick overview: • Galaxies • Multiple Star Systems • Constellations • Spectroscope Lab • Toilet Paper Solar System Lab • Characteristics of Stars • H-R Diagram • Measuring Star distances (parallax) • The Sun: Our special Star • Activities of the Sun
Introduction Activity • You are stranded on the Moon and you have 15 items to choose from. You must decided which ones are most important to take with you. Rank these items in order from 1-15, 1 being most important and 15 being the least important.
Box of Matches Food Concentrate 50 feet nylon rope Parachute silk Solar Powered Heating Unit Two .45 Caliber Pistols & Ammunition One case- Evaporated Milk Solar Powered FM receiver-transmitter Two 100-lb. tanks of oxygen Stellar Map (constellations as they appear from the moon) Self-Inflatable Life Raft Magnetic Compass 5 gallons of water Signal Flares First Aid Kit- Containing Injection Needles Stranded on the Moon:
Space Science Unit Mini-lesson Introducing the H-R Diagram
What is the H-R Diagram? Look at page 34 in your text
What does it do? • This chart uses surface temperature of the star and the absolute magnitude (brightness) of the star to help astronomers decide which phase of the star’s life cycle the star is in and other important information about the star. • Most stars are what we consider main sequence (including our sun). They make up 90% of the stars in our sky. These stars are the diagonal strip running through the middle of the chart.
This diagram is the single most important that astronomers use today. In the early 1900’s Ejnar Hertzsprung (Danish) and Henry Norris Russell (American) found a relationship between the absolute magnitude and the surface temperature. The men were working independently. Hertzsprung presented his information in 1905 in the form of tables, while Russell presented his observations in table form in 1913. Today the diagram is named for both men’s work in correlating a star’s brightness and surface temperature. Why is it so important?
Absolute Magnitude • Absolute Magnitude is the star’s actual brightness. Apparent Magnitude is how bright a star appears from Earth. The H-R Diagram is based on the actual brightness of a star. • If we place two stars were the same distance from the Earth, and measured their brightness, this would be their absolute magnitude. • Demo: Compare a flashlight and a pen light.
Surface Temperature • Astronomers use color as a guide to determine the temperature. • The hottest star is 50,000 °C • The coolest star is around 3,000 °C • Remember heating the metal rod in lab? The colors changed as the metal became hotter. • Remember the Surface Temperature is less here than the core of the star. We will look at this concept in depth when we study the sun and it’s layers.
So now what? • The stars are plotted on the diagram according to their surface temperature and absolute magnitude. • Once the stars are placed on the diagram, astronomers have noticed clustering of the plotted stars. • These clusters are grouped together into the various stages of a stars life cycle. • Let’s look at those briefly.
Main Sequence Stars • Make up 90% of the stars • These are medium sized stars • Our sun is a main sequence star • Sizes vary from 1/10 that of our Sun to 10 times that of our Sun • Stars stay in this part of their life cycle for a long time; most of their “lives” The Sun
Giant Stars • These stars are the next size up from the Main Sequence stars • They are 10-100 times as large as our Sun
Super Giants • The largest stars, larger than the giant stars • Their diameters are 1,000 times that of our Sun • A star this size would extend past Mars from where our Sun is now if compared to our Sun’s current size • Due to their size, they are the shortest lived stars and die off quickly
White Dwarfs • These are smaller than the sun and even the Earth • The smallest know white dwarf has a diameter that is less then the distance across Asia
Neutron Stars • These are the smallest stars • A typical neutron star is 16 km in diameter
Here’s what NASA thinks • http://cawg.cap.gov/html/AE/AE_Activities/2000%20July(a).htm If we have time…
Parallax • Now using the previous slide we will demonstrate the concept of parallax, which is the apparent change of a stars position in the sky. • The stars are not really moving, rather the Earth is and therefore we see different constellations during different seasons. • This is used to measure a stars distance from Earth as well.
This powerpoint was kindly donated to www.worldofteaching.com http://www.worldofteaching.com is home to over a thousand powerpoints submitted by teachers. This is a completely free site and requires no registration. Please visit and I hope it will help in your teaching.