Download
1 / 4
40 likes | 67 Vues
Learn how to perform a paired t-test to compare the mean difference between two samples using common statistical inference methods. Understand the assumptions, calculations, and interpretation of results in this statistical analysis.

E N D
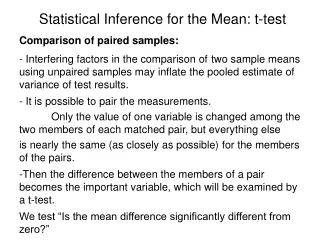
Statistical Inference for the Mean: t-test Comparison of paired samples: • Interfering factors in the comparison of two sample means using unpaired samples may inflate the pooled estimate of variance of test results. • It is possible to pair the measurements. • Only the value of one variable is changed among the two members of each matched pair, but everything else • is nearly the same (as closely as possible) for the members of the pairs. • Then the difference between the members of a pair becomes the important variable, which will be examined by a t-test. • We test “Is the mean difference significantly different from zero?”
Statistical Inference for the Mean: t-test Comparison of paired samples: Pair No. 1 2 3 4 5 6… n Sample A xA1 xA2 xA3 xA4 xA5 xA6...xAn Sample B xB1 xB2 xB3 xB4 xB5 xB6…xBn d =xAi-xBi xA1-xB1 xA2-xB2 xA3-xB3 xA4-xB4 xA5-xB5 xA6-xB6…xAn-xBn
Statistical Inference for the Mean: t-test Comparison of paired samples: Standard Deviation of d: Degrees of freedom is n-1 The test statistics t is: The paired t-test compares the mean difference of pairs to an assumed population mean difference of zero.
Statistical Inference for the Mean: t-test Test of Significance: Comparing paired samples • - State the null hypothesis in terms of the mean difference, such as • State the alternative hypothesis in terms of the same population parameters. • Determine the mean and variance of the difference of the pairs. • Calculate the test statistic t of the observation using the mean and variance of the difference. • Determine the degrees of freedom: • State the level of significance – rejection limit. • If probability falls outside of the rejection limit, we reject the Null Hypothesis, which means the difference of the two samples are significant. • Assume the samples are normally distributed and neglect any possibility of interaction. • Assume that if the interfering factor is kept constant within each pair, the difference in response will not be affected by the value of the interfering factor. df = n-1