Enhancing Radiotherapy: Combining TNF Gene Therapy with EPRI Imaging for Tumor Oxygenation
This study explores the synergy of genetically engineered adenoviral TNF therapy with radiation in enhancing tumor oxygenation, thereby improving radiation efficacy. We examined how the TNF selectively targets dysfunctional tumor vessels while preserving healthy ones. By utilizing advanced imaging techniques such as Image Registration and EPRI, we compared tumor oxygenation levels before and after treatment in a mouse model. Our results indicate a significant change in tumor pO2 levels post-irradiation, suggesting that targeted anti-vascular therapy may actually increase oxygenation and improve therapeutic outcomes.

Enhancing Radiotherapy: Combining TNF Gene Therapy with EPRI Imaging for Tumor Oxygenation
E N D
Presentation Transcript
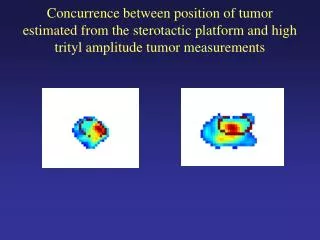
Concurrence between position of tumor estimated from the sterotactic platform and high trityl amplitude tumor measurements
Interesting common (though not universal) concurrence • of tumor and high EPR OX063 peak height from • correlation with MRI Using Image Registration: • Registered T2 or T2 weighted MRI • defines tumor voxels in EPROI MRI,
Therapeutic Puzzle • Oxygen known to potentiate radiation therapy • TNF known to produce vascular destruction • One would think that combining TNF with radiation would be a prescription for failure • BUT • Using a genetically engineered adenvirus to locally produce TNF in response to radiation gives the following
Probe the physiology with DCE and EPRI oxygen images • 9mm PC3 human prostate tumors in nude mice • Pre-treatment T2 and DCE MRI plus EPRI Oxygen images • 10 Gy Radiation plus AdEGRTNFa or sham • 3 days post Rx T2 and DCE MRI plus EPRI Oxygen images
Image pO2 Statistics • Control animals: Day 0 Day 3 • Mean pO2 55.1+/- 4 52.0+/-4.4 • 10 torr hypoxic Fx 5.8+/-2.0 5.0+/-3.8 • Treated animals • Mean pO2 53.0+/-1.3 72.7+/-3.5 • 10 torr hypoxic Fx 1.3 +/-0.3 0.2+/-0.2 • Significance of difference between Control and Treated on different days: • Day 0 pO2 p=0.8 • Day 3 pO2 p=0.01 Students 2 tailed t test
How can this be? • Antivascular therapy is increasing the oxygenation: How could this be • What if the antivascular therapy specifically targeted chaotic tumor vessels and had less effect on the well functioning ones • Ad EGR TNFa is locally produced. Tumor vessels can’t get rid of it but fully functional vessels can. • It’s a large molecule: on form 51KD, monomer 17KD • The TNF selectively eliminates chaotic tumor vessels and allows better oxygenation from the functioning vessels.
EPRI Oxygen Images PredictRadiation Curability of Tumors • MDAnderson FSa Fibrosarcomas in C3H mice • Radiation given to tumors of air breathing animals + loosely and tightly clamped tumors • Doses given near the TCD50 • Images obtained prior to therapy in same state • Tumor voxels determined with either co-registered MRI or stereotactic surface “touch”
EPRI Hypoxic Fraction Predicts Radiation Curability of Tumors Dose-Hypoxia Boundary HF10: Fraction of tumor voxels w pO2<10 torr XRT: p=0.01 EPRI oxygen: p=0.023
EPRI Hypoxic Fraction Predicts Radiation Curability of Tumors • Bivariate logit model of response • Dose correlates with cure p=0.01 • Fraction of voxels with pO2<10 torrcorrelates with cure p=0.023 • Slope of the boundary curve is approximately 1 Gy/%voxels less than 10 torr • Minimum cure dose (abscissa intercept): 25 Gy
Pulse: Another Approach to EPRI • As indicated in the first lecture, information about the reality term, the G or friction term which is a determinant of linewidth equally affects the Rate of decay of the transverse magnetization, • R2=1/T2. R2=dBg where g is the electron gyromagnetic ratio = 17.06 rad/sec/gauss
Deadtime Limits Pulse Detection • Magnetization created with a short high power pulse • To rotate magnetization from the direction of spin sample magnetization preparation (z axis) to the transverse axis conventionally taken as the x axis, RF B1 in the y direction to precess <S> by p/2 • Bloch’s equation with T1, T2≈ ∞, d<S>/dt=gB1 or gB1Dt=p/2 • Broad band pulse covers frequency encoded sample (Dn large) => Dt small =>B1 large => high power pulse • It takes time to dissipate the magnetization creation power to a low level for signal detection
Trityl Spin Probes Defeat Dead Time Limits for Oxygen Imaging • Pulse Problem: • Magnetization may relax before the excitation energy dissipates enough for detection • Solution: Spin probe with small relaxation rate (R) or long relaxation time (T=1/R) • Trityls have long relaxation times ~ 5ms • Dead time minimum ~ 0.5 ms so this works
Electron Spin Echo (ESE) Imaging • Diminishes the dependence of image noise on dead time • Pulse sequence π/2-τ-πspin echo imaging • t is the time between the p/2 and p pulses • Echo pulse is delayed t relative to the p pulse • Long relaxation times ~ 5 ms for trityls
Electron Spin Echo Experiment Measure magnetization voltage near here Magnetization envelope decay time constant=R2 = 1/T2
2-D Spin Echo Image of 3 Vials with Different Oxygen Concentrations
3-D Spin Echo Images of Vials with 0 and 3% Oxygen for Different τ
Histogram of Decay Rates Across the Image for 0% and 2% (15torr) Oxygen
T2 distribution (mG equivalent) σ: 0.28 mG equivalent to ~ 0.5 torr
Mouse leg/tumor Sagittal ESE CW ESE CW
Real Test of EPR Oxygen Imaging • Treat with radiation to a single dose – TCD50 • Model 450 ml FSafibrosarcomas, in legs of C3H mice • Tumor oxygenation status with ESE EPROI Do EPROI voxels with low pO2 predict radiation failure or success? • HF10- Fraction of voxels pO2 <10 torr
Tumor Control vs HF10 • HF10 < 9% Tumor control 18/20 or 90% • HF10 > 9% Tumor control 7/19 or 37% • Failed
39 Animals/tumors: pO2 statistics of failures vs controlled tumors
Freedom from Failure HF10 > or < 9% Wilcoxon Analysis p=0.0002
SBRT and IGRT enable safe delivery of high radiation doses/fraction (1-3Fx18-24Gy) to tumors residing in soft tissues, bone, lung and the liver • Single dose (≥24Gy) results in ~90% long-term local control of oligometastatic (M1) cancer regardless of the histological phenotype or the target organ of the metastatic lesion • Single large doses (>24 Gy) results in 80% disease free survival at 18 months for Stages I and II medically inoperable lung cancer, comparable with surgery.
MCA/129 Fibrosarcoma; 4hr after 15 Gy Human Ovarian Carcinoma Control 20 20 50% 0.35% 15 Apoptotic Tumor cells Apoptotic endothelial cells 15 10 10 17% 0.2% 5 5 17Gy 0 -Ceramide -ASMase 0 0 4 6 24 10 Time after 15 Gy (hours) Control 15 Gy 30 sec The earliest visible response of tumors to high-dose radiation is an acute wave of endothelial apoptosis • Initiated by a plasma membrane, not DNA damage, response • Involves ASMase activation and ceramide generation • Inhibited in apoptosis-deficient cells (asmase-/-, Bax-/-) • Does not effect DNA repair-deficient phenotypes (SCID, atm-/-)
The Apoptosis Inhibits Repair of Radiation Damage • Oxygen necessary for radiation damage repair • The vascular apoptosis creates rapid hypoxia • This sensitizes tumors to large doses of radiation • THE EFFECT HAS ONLY BEEN SEEN IN HISTOLOGIC SECTIONS, NOT IN VIVO
IS THERE A RAPID HYPOXIC RESPONSE IN VIVO? • Electron Spin Echo allows oxygen images in 10 minutes • Oxygen images can be obtained before a 20 Gy radiation dose • Compared with the oxygenation after the dose • Voxels from the tumor provide a large statistical sample. • Large variability of pO2 voxels in the tumor
pO2 slice before/after 20 Gy in ASMase +/+ C57 mouse TumorT2 MRI before experiment.
Results: Δtin 50 min (~30 min) post 20 Gy +/+: Significantly pO2 repair ↑ sensitivity
Results: Δt in 15 min post 20 Gy single image pre-post % change +/+: Significantly pO2 repair ↑ sensitivity
4 cm Rabbit Tumor Key: local arterial trityl perfusion
More Accurate R1 pO2 Images • R1=1/T1: Relaxation rate of longitudinal magnetization • Self interaction exchanges energy within the spin system • R2=1/T2: Relaxation rate of transverse magnetization • Self interaction indistinguishable from interaction with lattice or external spins
T1EPR oxygen image Try inversion recovery pulse sequence with electron spin echo detection (IRESE). With 30 MHz BW, little spin diffusion in trityls
Concentration Dependence of OX063H Relaxation Rates 0% O2 saline 370C 0.5 mM in saline 370C 50 50 -R2ee - R2e - R2e 45 45 - R1e - R1e - R1e 40 40 35 R [mG] 35 R [mG] 30 30 25 x 5 25 x 3 20 20 15 15 10 10 0 10 20 30 40 50 60 70 0.5 1 1.5 2 2.5 3 3.5 4 4.5 5 pO2 [torr] C [mM] Average concentration observed in mice is ~0.3 mM but actual concentration may be ~ 1 mM with 0.3 mM uncertainty. R1e uncertainty ~ 0.5 mG ~ 1 torr pO2 uncertainty
Orthogonal slices and histograms of: (left) T2based ESEpO2image (right) T1 based IRESE pO2image of tumor bearing leg of C57 mouse.
Scaling up in volume • CW oxygen imaging of mouse tumors: • Overmodulation • Rapid projection acquisition • Interpolation to recover spectral fidelity • Implementation of an intermediate size imaging system to • Explore rapid acquisition while obtaining data from the older small imager • Test proof of principle for the design of the larger magnet • Explore scaling to larger objects
30 cm DHV Large Magnet Achieves design homogeneity Multidirectional access
Promise of EPRI Oxygen Images Body part Tumor Hypoxic region Use the DOSE vs HYPOXIC FRACTION diagram to modify the dose to the hypoxic region only
IMRT Dose “Painting” increasing dose as above based on EPRI oxygen map Primary Tumor Dose Hypoxic Boost
Conclusions • CW 4D Images of phantoms can be obtained with ~1 mm spatial resolution and ~1.5mG spectral resolution or ~ 3 torr in ~ 30 minutes • Quantitative oxygen images spatially correspond to Oxyliteoxymeter measurements. • EPROI shows that anti-vascular agents attack ineffective tumor vessels -> improve oxygen delivery • EPR Oxygen images + dose predict tumor cure • T1based IRESE recover most of the oxygen accuracy at a small expense (30%) in SNR and give a 1 torr resolution with a 1 mm pO2resolution • EPRI may enable radiation dose painting • Larger tumor capability promises human imaging
Chicago EPR Lab: Howard Halpern Martyna Elas Boris Epel Chad Haney Charles Pelizzari Gene Barth VS Subramanian Brandi Butler Chanel Li Chemistry: Viresh Rawal T. Reddy Tetsuo Iwama MRI Lab: Greg Karczmar Jonathan River Marta Zamora Trityl Synthesis Novosibirsk Institute for Organic Chem. Victor Tormyshev