
Advanced Techniques in Standard Analysis Chain for Astrophysical Data Processing
E N D
Presentation Transcript
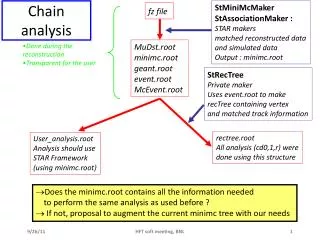
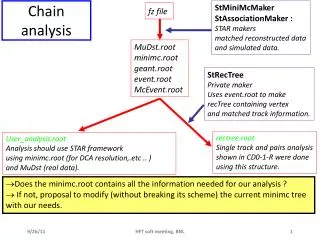
The Standard Analysis chain • Maybe will be Online Analysis later • Pedestal calculation seems stable • Calibration ? (New box and algos / Test) • Signal extraction (adaptation for shift in peak) • Camera rotation (Automatic procedures Javier L. / Daniel M.) Ways to parameterize and input • Hillas parameters and static cuts • False source plots and
The Standard Analysis chain • Questions • Should run for 1 night worth of data • Make flow diagram • How many data to combine (30 minutes?) • Which checks to perform on data sanity
Next Steps to implement /check • Check consistency of rotation of Crab / Mrk 421 data (can be done by inexperienced people) • Compare results from different groups • Make a systematic study of different cleaning procedures (Plots of Hillas parameters) • Make a systematic study of signal extraction algorithms (size comparisons for same events, MC comparisons)
Next Steps to implement /check • Search for Ying/Yang events (Like shown by Nadia). Do we have Ying/Yang events in February / March / April data. Write a MACRO to find them and count them. • Study of hot FADC racks (Correlation of Pedestal RMS with FADC crate number) • Study of effects of individual cuts
Checks for DC current analysis • Check of HV regulation on DC currents • First look of improvement in PSF in March data • Look at data with focus at infinity • Check of DC light calibration / flat fielding (Has it been done in the data?)
Checks on Pedestal calculation • Search for Stars using RMS values • Test of automatic procedure (MACRO) with February / March / April data • Comparison of pedestal RMS (no star area) with trigger rate
Calibration analysis • Check of effects of HV regulation • Study of calibration factors for different HVs • Comparison of 1 green (Why is March calibration consistent with February data but DC-currents not) • Test of automatic procedure (MACRO) with February / March / April data
Easy Data-Checks to implement • Image of pixels tagged as used pixels (Number of times pixel was used in Analysis for data runs) • Image of pixels with different levels of signal (Number pixel hat more the 100 photons signal) • Hit distribution on trigger Macro-Cells • Hit distribution on FADC crate number
New Work on MC calculations • Study of missing pixels (How do distributions change due to bad pixels, 15th of February data) • Write a MC to study the response of one PM (full diploma work). Include QE variations, signal fluctuations, WL dependance, Winston cones, etc.) • MC study of NSB / Starfield effects