Download
1 / 35
350 likes | 375 Vues
Explore the history and methods of predicting crop yield potential, including soil testing, nutrient recommendations, and agronomic factors influencing yield goals. Learn the significance of setting yield goals and predicting potential yield for optimal agricultural management. Discover how spatial variability and crop models can aid in forecasting nutrient needs and maximizing crop productivity.

E N D
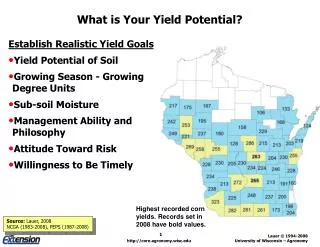
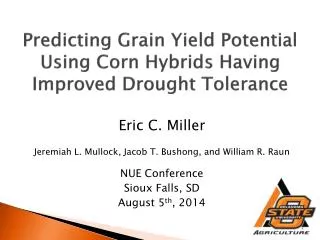
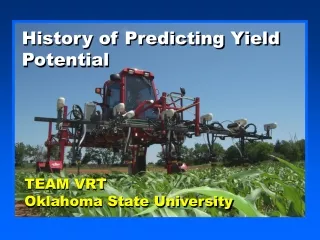
History of Predicting Yield Potential TEAM VRT Oklahoma State University
Outline • Yield Goals and Potential Yield • Soil Test vs. Sensor Based • Sufficiency: Mobile vs. Immobile Nutrients • Bray’s mobility concept • How to generate nutrient recommendations • What should we learn from soil testing • Subsoil nutrient availability • Soil Testing: Correlation/Calibration/Recommendation • Models for Interpretation of Response • Interfering agronomic factors
Yield Goal/Potential Yield • Yield Goal: yield per acre you hope to grow (Dahnke et al., 1988) • Potential yield: highest possible yield obtainable with ideal management, FOR specific soil and weather conditions • Maximum Yield: grain yield achievable when all manageable growth factors (nutrients, insects, disease, and weeds) are nonlimiting and the environment is ideal
Yield Goals in the Literature • Yield per acre you hope to grow (Dahnke et al. (1988). • Highest yield attained in the last 4-5 years and that is usually 30-33% higher than avg. yield (J. Goos, 1998). • Aim for a 10-20% increase over the recent average (Rehm and Schmitt, 1989). • Yield goal should be based on how much water is available (stored soil water to 1.5m, Black and Bauer, 1988). • When Yield Goals are used it explicitly places the risk of predicting the environment (good or bad) on the producer.
Value of Using Yield Goals • Nutrient removal can be reliably estimated for a given yield level in specific crops. • Selected Yield Goal defines the risk the producer is willing to take. • Yield Goal can define the limits in terms of economic inputs when considering herbicides, insecticides, etc.
Importance of Predicting Potential Yield • Seasonal N need directly related to observed yield. • NUE decreases with increasing N rate. • Known Potential Yield = Known N Input = Highest NUE.
YieldGoal Yield Goal +30% Grain yield Average Yield Bound by Environment and Management Max Yield YPMAX PotentialYieldYP0 Potential Yield with N, YPN
Predicting N Needs • Use of Yield Goals. • Based on past season yields. • May take into account current-year preplant conditions of available moisture and residual N. • Seldom is adjusted for midseason conditions to alter N inputs. • Use of Potential Yield. • Reliability of predicting final yield (and N requirement) from existing soil and crop conditions should increase as harvest approaches.
Spatial Variability and Yield Potential • Significant soil variability at distances less than 30 m apart (Lengnick, 1997) • In order to describe the variability encountered in field experiments, soil, plant and indirect measures should be made at the 1m or submeter resolution • Significant differences in soil test P, organic C, and pH were found at distances <0.30m (OSU)
Crop Response/Models to Predict Yield (N need) • CERES (Crop-Environment Resource Synthesis) crop response model was not useful in predicting wheat grain yield (Moulin and Beckie, 1993) • Complicated. • Total N uptake at Feekes growth stage 5 was found to be a good predictor of yield (Reeves et al., 1993) • Worked some, but not all years.
History of Predicting Potential Yield • 1. SF45 = (NDVI4 + NDVI5)/days from F4 to F5 • INSEY (in-season-estimated-yield) • GDD = (Tmin + Tmax)/2 – 4.4°C • 2. EY = (NDVI4 + NDVI5)/GDD from F4 to F5 • 3. INSEY = (NDVI)/days from planting to sensing • 4. INSEY = (NDVI)/days from planting to sensing where (GDD>0)
100 lb N/ac 45 bu/ac, 2.5% N in the grain 75 lb N/ac N uptake, lb/ac 50 lb N /ac days with GDD>0? October February June 0 120 240 days INSEY: Rate of N uptake over 120 days, > ½ of the total growing days and should be a good predictor of grain yield
Adjusting Yield Potential October 1 Benchmark Planting Date Planting Date F5 Date F4 Date Adj. Index 42+20=62 29+6=35 Perkins 42 20 143 185 Tipton 29 6 116 145
SF45 = (NDVI4 + NDVI5)/days from F4 to F5 growth YIELD POTENTIAL NDVI growth NDVI min F4 F5 Maturity Feekes growth stage
Total N Uptake 40 20 50 50 Feekes 4 Feekes 5 Grain Yield
6000 Perkins, N*P 5000 Perkins, S*N Tipton, S*N 4000 Grain Yield 3000 2000 y = 1E+06x2 - 12974x + 951.24 R2 = 0.89 1000 0 0.01 0.02 0.03 0.04 0.05 0.06 0.07 NDVI F4+NDVI F5/days from F4 to F5
INSEY = (NDVI + NDVI )/GDD T1 to T2 INSEY = (NDVI + NDVI )/GDD T1 to T2 T1 T2 T1 T2 14 14 12 12 10 10 8 8 Above ground dry Above ground dry S S NDVI NDVI 6 6 T1 T2 T1 T2 4 4 weight weight GDD GDD 2 2 0 500 1000 1500 2000 2500 0 500 1000 1500 2000 2500 0 0 Cumulative growing degree days Cumulative growing degree days Rickman, R.W., Sue E. Waldman and Betty Klepper. 1996. Rickman, R.W., Sue E. Waldman and Betty Klepper. 1996. MODWht3: A development - driven wheat growth simulation. MODWht3: A development - driven wheat growth simulation. Agron J. 88:176 - 185. Agron J. 88:176 - 185.
Field Experiments, 1998-2000. _____________________________________________________________________________________________ Experiment Location Year Date Planting Harvest Variety Planting to Sensed date date sensing, D/M/Y D/M/Y D/M/Y days S*N§ Perkins, OK 1998 6/4/98 21/10/97 15/6/98 Tonkawa 167 S*N§ Tipton, OK 1998 26/2/98 7/10/97 3/6/98 Tonkawa 142 N*P¶ Perkins, OK 1998 2/4/98 21/10/97 15/6/98 Tonkawa 163 N*P¶ Perkins, OK 1999 4/3/99 12/10/98 9/6/99 Tonkawa 143 Experiment 222 Stillwater, OK 1999 24/2/99 13/10/98 15/6/99 Tonkawa 134 Experiment 301 Efaw, OK 1999 24/3/99 15/10/98 15/6/99 Tonkawa 160 Efaw AA Efaw, OK 1999 24/3/99 9/11/98 15/6/99 Tonkawa 135 Experiment 502 Lahoma, OK 1999 5/3/99 9/10/98 30/6/99 Tonkawa 147 Experiment 801 Haskell, OK 1999 23/3/99 16/10/98 6/7/99 2163 158 N*P Perkins, OK 2000 8/2/00 8/10/99 30/5/00 Custer 123 Experiment 222 Stillwater, OK 2000 6/3/00 7/10/99 6/7/00 Custer 151 Experiment 301 Efaw, OK 2000 6/3/00 7/10/99 2/6/00 Custer 151 Efaw AA Efaw, OK 2000 6/3/00 7/10/99 7/7/00 Custer 151 Experiment 801 Haskell, OK 2000 14/3/00 8/10/99 2/6/00 2137 158 Experiment 502 Lahoma, OK 2000 13/3/00 12/10/99 13/6/00 Custer 153 Hennessey AA Hennessey, OK 2000 13/3/00 7/10/99 7/6/00 Custer 158
Normalized Difference Vegetation Index (NDVI) = NIR ref – red ref / NIR ref + red ref (up – down) excellent predictor of plant N uptake Units: N uptake, kg ha-1
100 lb N/ac 45 bu/ac, 2.5% N in the grain 75 lb N/ac N uptake, lb/ac 50 lb N /ac days with GDD>0? October February June 0 120 240 days INSEY: Rate of N uptake over 120 days, > ½ of the total growing days and should be a good predictor of grain yield
Normalized Difference Vegetation Index (NDVI) Reasonably good predictor of final grain yield
T1 + NDVI NDVIT2 EstimatedYield (EY) = GDD from T1 to T2 +Good predictor of final grain yield- Requires two sensor readings +GDD y = 0.4554e344.12x R2 = 0.62
NDVI at F5 In-SeasonEstimatedYield (INSEY)1 = days from planting to F5 +Good predictor of final grain yield+Requires only one sensor reading Units: N uptake, kg ha-1 day-1
NDVI at F5 In-SeasonEstimatedYield (INSEY)1 = days from planting to F5 Hard Red Winter Wheat (Oklahoma)Soft White Winter Wheat (Virginia)
In-SeasonEstimatedYield (INSEY)2 NDVI at F5 = days from planting to F5, GDD>0 +Good predictor of final grain yield+Requires only one sensor reading+Appears to work over different regions Units: N uptake, kg ha-1 day-1 where GDD>0
In-SeasonEstimatedYield (INSEY)2 NDVI at F5 = days from planting to F5, GDD>0 Hard Red Winter Wheat (Oklahoma)Soft White Winter Wheat (Virginia)
Can We Predict Yield with No Additional N Applied? YP0 • Can We Predict The Yield Increase If We Apply N in a Given Year? YPN • Can We Predict if Harvested Yield will be Less than Predicted Yield? YP?
Post-maturity yield loss 12 10 8 6 4 2 0 Above ground dry weight Harvest Cumulative growing degree days
VEGETATIVE REPRODUCTIVE R-NH2 NO3 NH4 R-NH2 Total N moistureheat Total N NH3 Safetyvalve amino NH NO NO 3 3 2 acids nitrate reductase nitrite reductase • NO3- + 2e (nitrate reductase) NO2- + 6e (nitrite reductase) NH4+
12 10 8 6 4 2 0 RainfallDiseaseFrost Above ground dry weight Harvest Cumulative growing degree days
NEXT Section…… ???? Predicting the Increase in Yield due to Applied N N uptake, lb/ac 40 N 0 N October February June