Download
1 / 30
300 likes | 318 Vues
This project aims to put current energy crop production, including woody crops like poplar, into a national context. It involves the coordination of data from various sources to develop yield estimates and map the yield potential of poplar across the United States.

E N D
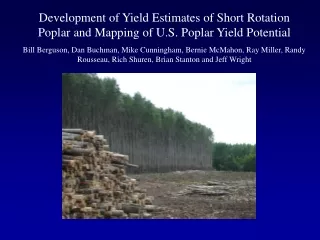
Development of Yield Estimates of Short Rotation Poplar and Mapping of U.S. Poplar Yield Potential Bill Berguson, Dan Buchman, Mike Cunningham, Bernie McMahon, Ray Miller, Randy Rousseau, Rich Shuren, Brian Stanton and Jeff Wright
National Energy Crops Mapping Project • Requested by DOE (Bryce Stokes) to put current energy crop production (including woody crops) into a national context • Coordination of the project done by Laurence Eaton at ORNL • Sun Grant/DOE Poplar Team provided data to construct a common national dataset (the best available at the current time) • Analysis done by Oregon State PRISM Climate group (Chris Daly and Mike Halbleib) using gridded climate and soils data • OSU developed crop production indices for regression against our dataset to develop “backbone” for extension of poplar yield nationally
Clarifying Notes - Stand Metrics • Yield – all aboveground components without leaves in oven-dry condition • Basal Area – the sum of the cross-sectional area of all trees expressed on an areal basis (square feet per acre in our case) • The product of BA and height is linearly related to total stand volume
Yield Data Sources • Data types and immediate utility varied across regions • Minnesota – used research yield block data of new clones on commercial production acreage with extrapolation to age 10 • Pacific Northwest – Primarily irrigated dataset, decided to drop irrigated plots in final analysis – rain-fed only sites • Mid-South and South Alluvial – measured commercial plantations established by MWV • Southern Uplands (ArborGen data) – due to little data, we attepted to take advantage of new data from clone tests on uplands (pine and agricultural sites) in the region • Emphasis on potential yield using selected clones for each region
Minnesota Yield Data • Yield blocks embedded in operational plantings on Verso Paper land • Typical 7 X 7 tree blocks with 3 replications • Interior 9 trees measured X 3 reps = 27 observations per clone/site • Mean annual increment extrapolated to age 10 using average free-to-grow incremental BA and height growth in recent history of each plot
Minnesota Yield Site Locations • Well-managed plantations with no significant fertilization history • All on agricultural sites of moderate productivity except Waseca (very highly productive agriculture site)
Minnesota Yield Dataset • Relatively straightforward process with some concerns due to differences in spacing and rotation age • Most stands at or near rotation age • Used new hybrid clone set resulting from breeding program or select P. deltoides – some NM6, DN5 • Yields generally higher than those reported in “Growth, Yield, and Disease Resistance of 7- to 12-Year-Old Poplar Clones in the North Central United States” D.A. Netzer et.al. GTR-NC-229, 2002
Example of extrapolation method for MN sites solid line is measured, dashed line is extrapolated • Used recent historical “free-to-grow” steady state production rate to age 10 • Average gap of extrapolation is 3 years, average MN yield is 3.9 tons/ac/yr
Mid-South Alluvial Dataset • Long-term commercial plantation program with good plantation management, no fertilization throughout rotation • Randy R. hired contractor to establish and measure growth plots at eight sites and 30 clone/site combinations • At total of 1,495 DBH measurements on 55 plots with subset of height (n=164) • Numbers input and crunched at UMD-NRRI and yields estimated
Mid-South Alluvial Sites (MO, KY, IL) • Average spacing is 270 TPA or 13 X 13 feet spacing (potential at higher density unknown currently) • Data ultimately collapsed to eight sites with the average of the clones occurring at those sites • Due to wide spacings, a 9 year rotation age assumed with data either used directly for those sites greater than age 9 or extrapolated based on MAI:age relationship across the dataset and ratio of current to predicted Age 4 superior clone in DOE/Sun Grant Consolidated Clone Test (photo courtesy of Randy Rousseau)
Southeast Uplands Dataset Very difficult to find single-clone blocks over a sufficient time period using material selected from tests in the region Used ArborGen’s unique series of clone tests across the Southeast ranging from sites in GA, SC, NC and AL
Development of Reference Yield Curves for Clone Tests on Southern Uplands • Lack of data on selected clones planted on upland sites in the Southeastern US in yield blocks on representative sites • Growth from some published studies showed very low growth rates which were not consistent with observations across the ArborGen’s network of trials in the area • Any existing yield data is in private hands and unavailable (lost/discarded after program termination) • Challenge – how to make use of ArborGen’s clone trial network data to estimate yield potential • Can we use measured clone trial height of top clones as indicator of yield potential?
Development of Reference Yield Curves for Clone Tests on Southern Uplands • Decided to evaluate long-term datasets of poplar growth in regions particularly if spacing varied in the study and data were collected over a rotation • Through help of Rich Shuren and Brian Stanton, we were provided with two long-term datasets with variable spacing • 1984 study • 1990 study • USFS-Stoneville – Roger Krinard • Nelder plot spacing trial • Large block test • Selected the GreenWood Resources 1984 and KrinardNelder Plot datasets as these included a range of spacings over a sufficient period with tree height and diameter • Evaluated expected stand basal area and height growth through time to develop a set of expected stand BA and height with known final rotation MAI • Used expected height to compare against measured clone trial height growth to estimate stand production
GreenWood 1984 Study (Thanks to Rich and Brian) • GreenWood Resources 1984 study • Westport - unirrigated • Spacing treatments in a 5 X 5 matrix of 3, 4, 6, 8 and 12 feet width reciprocal combinations for a total of 25 treatments • Spacing ranged from 3X3 feet to 12 X 12 • Three replications, 25 tree/plot, 1,876 observations • Diameter measured age 2 through 8 annually • Height measure age 3 through 7 • Clone Hybrid 11 • Unique opportunity to explore growth curves through time and spacing effects
Regression Analysis Results for Tree Height GreenWood Resources 1984 Study AvgHT = 17.1 + 4.48 StandAge - 0.234 SqftperTree + 0.0632 AgeXSqft-tree (R-squared = 85%)
Regression Analysis Results of Stand Basal Area GreenWood Resources 1984 Study StandBA = - 7.94 + 27.4 StandAge - 0.333 SqftperTree - 0.0692 AgeXSqft-tree (R-squared = 84%)
GreenWood 1984 MAI Biomass Production Although not shown, age 8 BA and volume decreases in dense treatments and increases at wider spacings Stands appear to hit a maximum of 190 square feet per acre and then begin slow decline (max MAI has been reached) regardless of spacing Similar behavior in the North
KrinardNelder Plot Study (USFS - SO 322) • Study reported on data through age 19 but used through age 9 • Reported average diameter and height in plots, we translated to MAI • Nelder Spoke Design – from 6 X 6 equivalent (1135 tpa) to 26 X 26 feet (63 tpa)
Regression of Tree Height on Age and Spacing KrinardNelder Plot Height = 21.1 + 5.32 StandAge + 0.00237 SqftXAge(R-squared = 0.86)
Regression of Stand Basal Area on Age and Spacing KrinardNelder Plot Data StandBA = 10.2 + 17.8 StandAge - 0.0385 Sqft-Tree - 0.0140 SqftXAge(R-squared = 0.85)
Yield Estimates for Southeast Uplands • Were used the ratio of mean height of the top 10 clones in clone tests to that estimated from the mean of the two models (Krinard-Nelder and GWR84) • Calculate the % reduction in MAI based on same models estimating MAI using age and stand spacing • Used expected versus actual height to adjust MAI accounting for spacing • Need more data and will continue to collect over time • Assumed a rotation age of 7 except for slow-growing sites such as Moultry (8)
Comparison of Krinard (SO 347) and 0.4085XBAXHt Bole Volume Estimation (outside-bark volume total bole)
Arborgen Poplar Specific Gravity Study Blue bars: Hybrid Red bars: P. deltoides • Average SG of 0.35 for poplar in South, Mid-South and Midwest = 22 lbs/cubic foot density • Generalized biomass equation: OD tons (all aboveground components – top, limb, bole, bark) = BA X Ht X 0.4085 X 22 X 1.2 • Consistent with Krinard and northern volume estimates (actually universal) with density remarkably similar across regions
Final Dataset for Calibration • After meeting with OSU staff in Corvallis, collapsed dataset to 19 sites
Final model calibration from OSU site scores (Mike Halbleib/Chris Daly) South Uplands - Bellville, GA, Floyd, GA, Eastover, SC Minnesota – Improved Clones Alluvial Mid-South Moultry, SC – Extremely Droughty
U.S. Map of Poplar Production Potential • Note: red stars indicate site locations in the calibration dataset – not the case for PNW
Observations • Analysis of available yield data from Alluvial South (USFS-Krinard) and Pacific Northwest (GWR-Stanton/Shuren) shows that height growth is significantly higher in the PNW and South compared to Midwest • However, stand basal area production across all regions is much more consistent through time with final age stand BA of 160 to 180 ft2 acre-1 across regions expected (mean annual production higher in South and PNW due to tree height and slightly higher BA growth) • Growth curves in height and stand basal area developed from GWR dataset may have utility in guiding research in high-density plantings in other locations • Due to heavily leached soils in the Southern upland region, site selection (pH) and fertilization will likely play a greater role in that region • Unique opportunity to compare loblolly pine growth rates to cottonwood in paired sites in ArborGen’s set of trials (pellet market may be very attractive for cottonwood and hybrids) • - Continued measurement and expansion of tests in all regions and, particularly Southeast Uplands, will help better define yield potential and site effects
Final Thoughts • Dataset fraught with various issues that leads to imperfect, but reasonable estimates of yield potential based on actual field data • Spacing and coppice effects on yield in all regions unknown and need work • SE US yield – continued measurement of existing clone trials and next generation of large-block yield tests needed using best clones • SE US – effects of drought periods on uplands unknown but poplar surviving well on some very drought-prone sites (Moultry) • Clone selection critical and extreme variation is evident in clone tests in all regions • Opportunities for significant yield improvement through genetics at all locations Acknowledgments: Sun Grant Program – Tim Rials Chris Daly, Mike Hableib – OSU Laurence Eaton – ORNL Bryce Stokes – CNJV Don Kaczmarek - perspective on poplar yield in the SE