Download
1 / 36
380 likes | 798 Vues
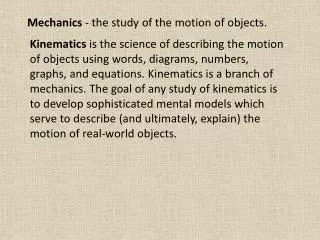
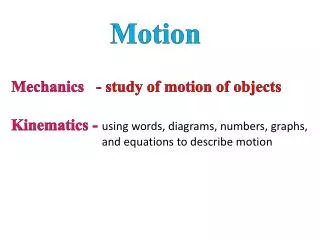
Motion. Mechanics - study of motion of objects Kinematics - using words, diagrams, numbers, graphs, and equations to describe motion. Distance and Displacement. Distance ( scalar ) - how much ground an object has covered during its motion .

E N D
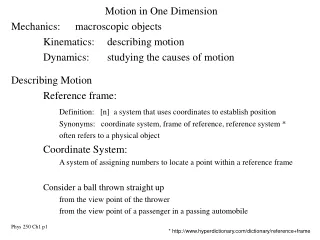
Motion Mechanics - study of motion of objects Kinematics - using words, diagrams, numbers, graphs, and equations to describe motion
Distance and Displacement Distance (scalar) - how much ground an object has covered during its motion. Displacement (vector) - how far out of place an object is; object's overall change in position.
Distance Distance (scalar) - how much ground an object has covered during its motion. A physics student walks 4 meters East, 2 meters South, 4 meters West, and finally 2 meters North. What distance was covered?
mph km m s s
Average vs. Instantaneous Speed Instantaneous Speed - the speed at any given instant in time Average Speed - the average of all instantaneous speeds; found simply by a distance/time ratio.
Graphing – Distance or Position distance vs. time position vs. time
Position vs. time Graphing – Activity 1-1, 1-2 Additional Physics Real Time Physics Mechanics L01A1-1a (Distance) L01A1-1b (Away and Back)
Position vs. time Graphing – Activity 1-3 Additional Physics Real Time Physics Mechanics L01A1-2 (Position Match) SHOW HIDE DATA BROWSER Each person in group match their own graph and then show me.
Graphing – Position vs. time rightward (+), CHANGING velocity Acceleration rightward (+), CONSTANT velocity
Position vs. time - slope SLOPE gives information Slow, Rightward(+)Constant Velocity Fast, Rightward(+)Constant Velocity Slow, Leftward(-)Constant Velocity Fast, Leftward(-)Constant Velocity
Position vs. time - slope SLOPE gives information Positive (+) VelocityFast to slow Negative (-) VelocitySlow to Fast Negative (-) Velocityfast to slow Positive (+) VelocitySlow to Fast negative acceleration– moving in negative direction, speeding up moving in positive direction, slowing down positive acceleration – moving in negative direction, slowing down moving in positive direction, speeding up
Displacement Displacement (vector) - how far out of place an object is; object's overall change in position. How much is the skier displaced during these three minutes? What distance did he travel?
Distance vs.Displacement http://www.youtube.com/watch?v=Lha8SgQ_4fE
Calculating Average Speed and Average Velocity
Average Speed and Average Velocity Use the diagram to determine the average speed and the average velocity of the skier during these three minutes.
Average Speed and Average Velocity What is the coach's average speed and average velocity?
The Passing Lane Velocity vs. Time
The Passing Lane Position vs. Time Velocity vs. Time
Velocity vs. time Graphing – Activity 2-1 Additional Physics Real Time Physics Mechanics L01A2-1 (Velocity Graphs)
Velocity vs. time Graphing – Activity 2-2 Additional Physics Real Time Physics Mechanics L01A2-2 (Velocity Match) SHOW HIDE DATA BROWSER Each person in group match their own graph and then show me.
Describing Motion: Velocity vs. Time Graphs Positive VelocityZero Acceleration Positive VelocityPositive Acceleration
Velocity vs. time - slope The velocity-time data and graph would look like the graph below. Note that the line on the graph is horizontal. That is the slope of the line is 0 m/s/s. In this case, it is obvious that the slope of the line (0 m/s/s) is the same as the acceleration (0 m/s/s) of the car.
True or False: When acceleration is 0 m/s/s, an object never moves.
Review v-t graphs Describing Motion with Velocity vs. Time Graphs
Review v-t graphs Describing Motion with Velocity vs. Time Graphs
Acceleration 1. Which car or cars (red, green, and/or blue) are undergoing an acceleration? Study each car individually in order to determine the answer. 2. Which car (red, green, or blue) experiences the greatest acceleration? 3. Consider the position-time graph at the right. Each one of the three lines on the position-time graph corresponds to the motion of one of the three cars. Match the appropriate line to the particular color of car.
Understanding p-t, v-t, and a-t graphs Constant Positive Velocity
Understanding p-t, v-t, and a-t graphs Constant Negative Velocity
Understanding p-t, v-t, and a-t graphs Positive Velocity and Negative Acceleration
Understanding p-t, v-t, and a-t graphs Negative Velocity and Negative Acceleration
Understanding p-t, v-t, and a-t graphs Negative Velocity and Positive Acceleration