Download
1 / 20
200 likes | 363 Vues
AGU Fall Meeting 2007, 10-14 Dec., San Francisco, CA. Carbon balance assessment of a natural steppe of southern Siberia by multiple constraint approach. L. Belelli Marchesini (1), D. Papale (1), M. Reichstein (2), N. Vuichard (1), N. Tchebakova (3) , and R. Valentini (2007)

E N D
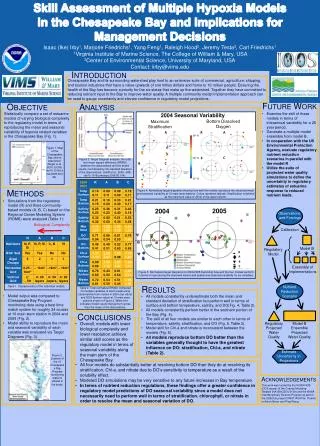
AGU Fall Meeting 2007, 10-14 Dec., San Francisco, CA. Carbon balance assessment of a natural steppe of southern Siberia by multiple constraint approach L. Belelli Marchesini (1), D. Papale (1), M. Reichstein (2), N. Vuichard (1), N. Tchebakova (3) , and R. Valentini (2007) Biogeosciences 4, 581-595. 1.Department of Forest Resources and Environment, University of Tuscia, Italy 2.Max Planck Institute for Biogeochemistry, Jena, Germany 3.Sukachev Insitute of Forest, SB-RAS, Krasnoyarsk, Russia
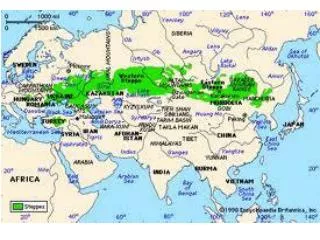
Site location Eddycovariance towers HAK 3 СОЛЁНООЗЁРНОЕ ШИРА AGU Fall Meeting 2007, 10-14 Dec., San Francisco, CA. Khakassia – region of Shira Hak1 (54°72’ N; 90°00’ E) 10 km
Site features AGU Fall Meeting 2007, 10-14 Dec., San Francisco, CA. Climate: semi-arid cool (BSk) (Koppen climate classification) MAT: 0.4 °C, great continentality (T(Jan)-T(Jul)= 35.0 °C) MAP: 304mm ( 245mm May to September). Soil :chernozem (second level legend FAO-Unesco 1990) Land Use: managed as a pasture until 2001 Plant composition: 102 species, perennial living forms prevail (76%), dominant species: Festuca valesiaca Gaudin, Koeleria cristata L., Stipa krylovi Roshev., Cleistogenes squarrosa Trin., and Poa botryoides Trin. ex Griseb.
Background AGU Fall Meeting 2007, 10-14 Dec., San Francisco, CA. • Eddy covariance technique is most applicable : (1) over flat terrain (2) when underlying vegetation extends upwind for an extended distance (3) when the environmental conditions are steady Violation of these assumptions can cause systematic errors in the interpretation of eddy covariance measurements, which can magnify when integrated over time to produce daily and annual sums (Baldocchi, 2003) • Importance of conducting comparative studies with biomass inventories to constrain flux measurements (Barford et al.,2001; Curtis et al.,2002;Ehman et al., 2002). These studies were carried out so far in forest ecosystems. • Steppes offer the possibility to operate with relative simplicity monitoring root biomass over time compared to forest ecosystems, although the task still remains time and labour consuming
Ecological inventory approach Atmospheric CO2 TER Rl+Rr E.C. Rh NEE NEP GPP NPP AGU Fall Meeting 2007, 10-14 Dec., San Francisco, CA. • Approach 1- inventory based on measurements of carbon stocks changes (ΔC soil, biomass,litter): differences in soil carbon content not detectable with significativity if not after several years. (Conan et al., 2003; Smith,2004). • Approach 2: inventory based on biometric and ecophysiological measures
Biometric measurements AGU Fall Meeting 2007, 10-14 Dec., San Francisco, CA. • Biomass samplings carried out along the growing season (1 May-30 Sep) • Aboveground (AG) total biomass + litter sampled over random plots (0.25m2) every 15 days, then sorted into live and dead • Belowground (BG) biomass sampled in the same plots (core depth: 30 cm), but every 30 days. • Collected matter dried at 70°C and weighed • C content= 0.45*biomass
NPP assessment methods AGU Fall Meeting 2007, 10-14 Dec., San Francisco, CA. Six algorithms generally used for estimating NPP of grasslands (Scurlock et al, 2002), each with own assumptions, number of inputs required to describe biomass dynamics (AG, BG productivity, decomposition), leading to different results In this study we applied: • NPP (AG, BG)= Σ(Δ(AGTotmat + BGTotmat)) ; Δ>0 • Singh et al (1975) • (2)NPP (AG,BG)= Σ (Δ AGTotmat + Δ BGTotmat +( r(ag,bg) · (AG,BG)Totdead)) • Long et al. (1989); after Weigert & Evans (1964). • (3)NPP (AG) = Σ (Δ ((AG) bmass + (AG)Totdead)); Δ>0 • NPP (BG) = Δ BGTotmat (ingrowth cores) • Persson (1983); Cuevas & Medina (1988).
Eddy covariance tower AGU Fall Meeting 2007, 10-14 Dec., San Francisco, CA. Sonic anemometer (Gill R3) (u,v,w,T) Infra red gas analyzer (LI 7500) (ρCO2, ρH2O) PPFD total,diffused T air Net radiation RH air Atmospheric pressure Rain T soil (-5,-10cm) Soil moisture (0-30cm) Soil heat flux
Eddy covariance data processing AGU Fall Meeting 2007, 10-14 Dec., San Francisco, CA. • Acquisition and processing software (MASE) (Manca, 2003) • Post processing corrections • (3D rotation, spectral correction, WPL correction, storage term) • Despiking – (Papale et al., 2006) • u* threshold for data rejection (Reichstein et al., 2005; Papale et al., 2006) • Gapfilling: (NLR) non linear regressions • (daytime-NEE=f(PPFD); nighttime-NEE=f(Tsoil)) (Falge et al. 2001) • (MDS) marginal distribution sampling (Reichstein et al, 2005) • (ANN) artificial neural network (Papale and Valentini, 2003) • Flux partitioning (GPP= Reco – NEE): • temperature response functions used for nighttime gapfilling by NLR • Algorithm of Reichstein et al. (2005)
Chamber based measurements – overview of instruments and techniques AGU Fall Meeting 2007, 10-14 Dec., San Francisco, CA. • Soil respiration (SR) measurements every week (EGM2, PP Systems) • Paritioning of heterotrothic component (Rh) by root exclusion rechnique (Hanson, 2001) – (trenching, root removal): plots prepared 12 months in advance to avoid enhanced fluxes because of decomposition of excised dead roots. • Nighttime meaures of CO2 effluxes by low canopy chamber (CPY2)
Methods: uncertainties AGU Fall Meeting 2007, 10-14 Dec., San Francisco, CA. • Uncertainty of NPP assessment and cumulated Rh • combination of uncertainties by addition (1) and multiplication (2) (IPCC, 2000): • Uncertainty of eddy covariance based NEP • Random error of 30 min eddy covariance fluxes: 30% • Systematic error: allowing 50% of the standard random cancellation of errors of 30 min fluxes on daily totals of NEE and no cancellation in the accumulation of daily totals on long term NEP. (Ehman et al, 2002). • Gapfilling uncertainty after Moffat et al. (2007) • NEP sensititvity to u* threshold : within the 5-95% percentile values of u* threshold estimate (0.04 and 0.085 m s-1 respectively).
Results: NPP assessment AGU Fall Meeting 2007, 10-14 Dec., San Francisco, CA. method 1 (sum of positive increments of AG and BG biomass): 7.70±3.15 tC ha-1 (95% c.i); method 2 (sum of changes in AG and BG biomass + decomposition): 3.87±1.03 tC ha-1 method 3 (AG as method 1; BG NPP-ingrowth cores): 2.89±0.77 tC ha-1. average NPP: 4.82±1.65 tC ha-1. BGNPP/tot NPP: 0.87 (1), 0.84 (2), 0.71 (3)
Results: NEP by flux monitoring (E.C.) AGU Fall Meeting 2007, 10-14 Dec., San Francisco, CA. The cumulated NEP over the monitored period was 150.5, 149.8 and 154.7 gC m-2 according to the methods of gapfilling of non linear regression, MDS and ANN (average of NEP assessments: 151.7 gC m-2).
Results: Partitioning of soil respiration AGU Fall Meeting 2007, 10-14 Dec., San Francisco, CA. Soil CO2 effluxes of autothrophic origin ranged between 18% and 50% (average 25%) during the period of most intense plants growth, from mid May to the end of July. Over the whole growing season (May-September) heterothrophic respiration accounted for 79% of total soil respiration.
Chamber based measurements – EC vs chamber based measurements of Reco AGU Fall Meeting 2007, 10-14 Dec., San Francisco, CA. For u* greater than 0.06 ms-1, the comparison between the two techniques evidences a fairly good match with chamber based fluxes being on average still higher than eddy covariance measurements (Reco(CPY2)=1.15 Reco (EC)-0.07; R2=0.83; n=7). Differences in fluxes did not overcome 1.21 mmolCO2 m-2 s-1 and were limited in the range -2%÷+36% in respect with the eddy covariance measurements.
Multiple constrained NEP – Carbon balance estimates AGU Fall Meeting 2007, 10-14 Dec., San Francisco, CA.
Final considerations AGU Fall Meeting 2007, 10-14 Dec., San Francisco, CA. • Both eddy covariance and ecological inventory methodologies face significant difficulties, resulting in potential systematic biases of unknown magnitude or sign that are currently the subject of significant efforts inthe ecological and micrometeorological communities. • This study is not intended to be an absolute validation of one methodology against the otherand in the accurate evaluation of the uncertainties of each approach, but it tries to focus on the merits and flaws of each method providing a comparison for results of NEP for a specific environment, steppe plains, where it is possible to minimize the sources of error of both methodological approaches.
Conclusions 1/2 AGU Fall Meeting 2007, 10-14 Dec., San Francisco, CA. • The carbon balance of the monitored natural steppe showed according to micrometeorological measurements, an uptake of carbon of 151.7±36.9 gCm-2 cumulated during the growing season form May to September. • This result was in agreement with an independent estimate through ecological inventory which yielded a sink of 150.1 gCm-2 although this method was characterized by a large uncertainty (± 130%) considering the 95% confidence interval of the estimate.
Conclusions 2/2 AGU Fall Meeting 2007, 10-14 Dec., San Francisco, CA. • Belowground processes in steppe ecosystems account for a pre-eminent part of the carbon exchange: in particular efforts to better quantify the dynamics of root biomass (growth and turnover) have to be undertaken in order to reduce the uncertainties in the assessment of NPP. • This assessment should be preferably based on the application of multiple methods , each one characterized by its own pros and cons.