Download
1 / 37
370 likes | 532 Vues
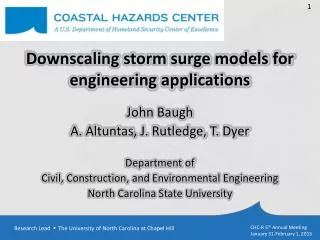
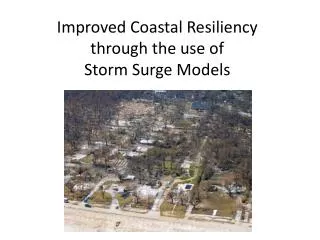
Improved Coastal Resiliency through the use of Storm Surge Models. What Is Coastal Resiliency ?. For the purpose of this presentation “Coastal Resiliency” is: The ability to make informed decisions during a storm/storm surge event Understanding the threat Evacuation decisions

E N D
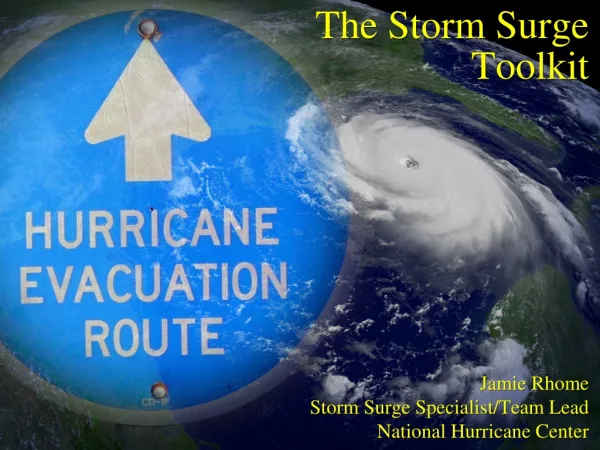
Improved Coastal Resiliencythrough the use ofStorm Surge Models
What Is Coastal Resiliency ? • For the purpose of this presentation “Coastal Resiliency” is: • The ability to make informed decisions during a storm/storm surge event • Understanding the threat • Evacuation decisions • Should I evacuate ? • Do I have to evacuate ? • Where do I evacuate to ? • In which direction do I evacuate ?
What is Storm Surge? A “piling up” of water along a coastline
Factors contributing to storm surge • Wind – usually associated with a tropical storm or hurricane • Wind direction • Wind speed • Fetch – the distance over which the wind interacts with the surface of the ocean • Time – the length of time wind blows over an area of the ocean Strong wind+large fetch+long time=highest surge
Factors Contributing to Storm Surge • Low (air) pressure over the ocean • Tides • Waves • Slope and width of the continental shelf • Friction • Coastal geometry
The Continental Shelf Factor Note the difference in the width of the continental shelf from western Florida, to Mississippi/Louisiana, and Texas
What Storm Surge is Not • Storm surge is not: • High tide • High waves • Limited to the immediate coast
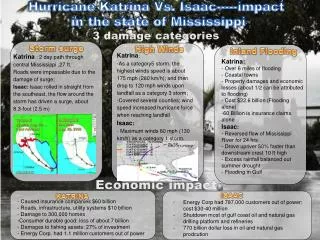
Not Limited to the Coast ? • Katrina showed us that surge can impact inland areas Inland Storm Surge Storm surge along the coast also forced adjoining waters in bays and bayous to rise. As a result residents as far as 10 miles inland were flooded. Some areas were flooded from the south (coastal ocean water) and from the north (overflowing bays and bayous).
Factors Contributing to Storm Surge • How it all piles up: • low pressure system (storm) generates wind • wind blows across the sea surface • friction between the wind and water pushes the water in the direction of the wind • tides caused by the gravity of the sun and moon cause the ocean surface to rise • the ocean starts to pile up along the coastline • waves form on top of the newly arisen sea
Is Storm Surge a Real Threat ? Katrina Storm Surge Damage
Is Storm Surge a Real Threat ? Katrina Storm Surge Damage – Coastal Mississippi
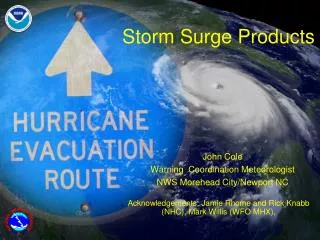
How is Storm Surge Predicted • Numerical models are used for prediction • What is a numerical model? • Mathematical equations describing the physics of the ocean in four dimensions • North/South (y) • East/West (x) • Up/Down (z) • Time (t) • The equations are solved starting with ocean and atmospheric observations (past and present) and then run forward in time • Supercomputers are used for the calculations
Storm Surge Prediction Models • Two surge forecast models are used today • SLOSH (Sea, Lake, and Overland Surges from Hurricanes) • SLOSH – Principal users National Weather Service/National Hurricane Center • ADCIRC – (Advanced CIRCulation) • ADCIRC Principal users - US Navy, Army Corps of Engineers • ADCIRC is a newer higher resolution model but its accuracy is a topic of scientific debate when compared to SLOSH
The Next Challenge The observations have been taken for days, the computer based surge forecast models have been running for days. Now what do you think is the next very important step in the forecasting process?
Communication of Information • The challenge • Myriad of information • General public level of knowledge • Transmission of information • Multi modal is essential • Format • Readable • Understandable
Communications Examples Cone of Uncertainty Best Track Confusing Graphics “Reality TV” Reporting
Communications Examples Wind Speed Probabilities Covering Too Large an Area Storm Surge Forecast Difficult to interpret These examples do not answer the question “How will I be affected?”
Communications Examples Along the Mississippi coast evacuation advisories are based on one’s location relative to a flood zone (A,B, or C). The maps used to display the zones are not unlike this chart – illegible especially when it occupies the lower third of the TV screen.
What Do People Really Need ? • Accurate information • Information that is relevant to: • My neighborhood • My evacuation route • Information that is easy to understand • Decisions are being made under great stress
A New Approach • Visualization of pertinent data • With respect to storm surge • Where will the surge strike ? • How deep will the water be ? • How will it affect adjacent areas (evacuation planning)? • How will it affect my business ? • How will it affect my home ?
A New Approach • The Center of Higher Learning Visualization Center (University of Southern Mississippi) has developed a way to link storm surge forecasts to existing geographic, topographic, and structural imagery to create broad area over views and neighborhood specific views of the forecast impact of the surge. • The technique answers all of the questions on the previous slide
A New Approach • On the following slides: • Irregular objects are data artifacts • Buildings that appear to be cloth covered are airborne laser images that have not been replaced with digital photographs • Regularly shaped building are digital photography superimposed on laser imagery • Work to remove artifacts and cloth apperances is underway at CHL
A New Approach Pass Christian Gulf of Mexico I-10 Bay St. Louis Hwy 90 Coastal Mississippi Prior to Storm Surge
A New Approach Inland Flooding Coastal Flooding Coastal Mississippi at Peak Storm Surge
A New Approach Coastal Video Clip
A New Approach Gulfport Mississippi Prior to Surge
A New Approach Gulfport Harbor Gulfport Mississippi at Peak of Storm Surge
A New Approach Water level is about 10 ft above street level or nearly 25 feet above sea level High Resolution Downtown Gulfport
A New Approach Gulfport Video Clip
A New Approach Beau Rivage Hotel Biloxi Mississippi Prior to Storm Surge
A New Approach Elevated entrance Water height approx 20 ft. Beau Rivage Hotel Biloxi Mississippi High Water from Surge
A New Approach Biloxi Video Clip
A New Approach • Scientifically accurate information • Surge model output to be linked with visual images • This project is in progress • Tailored view of your area of interest • Shows you the information you need most • In a format that leaves little to interpret • In a format that is easily understood
A New Approach • Dissemination of information: • TV • Internet (PC, laptop) • Internet (Blackberry, PDA) • Pre packaged video of storm surge simulations • CD • Internet
Storm Surge Visualization • Can also be used for: • Emergency planning • First responder training • Insurance coverage determination • Reclassification of designated flood zones • Educating the general public
Summarizing • Storm surge is very destructive • Communication of surge forecasts is inadequate • People need to quickly understand the potential danger of storm surge in order to make good evacuation decisions • Tools such as the CHL visualization products are being developed to effectively communicate storm surge information
Acknowledgements • The following resources were used in preparing this lesson • National Oceanic and Atmospheric Administration • National Hurricane Center • The Weather Channel • Precision Graphics • Google • Center of Higher Learning • Visualization Center • Geospatial Information Systems Laboratory