Demand Analysis
By: Malik Abrar Altaf Lecturer, Management Dr.S.M.Iqbal Business School. Demand Analysis. Demand Defined:. Demand. Desire. Need. “ A person when desiring is willing and able to pay for what he/she desires , the desire is changed into demand.


Demand Analysis
E N D
Presentation Transcript
By: Malik Abrar Altaf Lecturer, Management Dr.S.M.Iqbal Business School. Demand Analysis
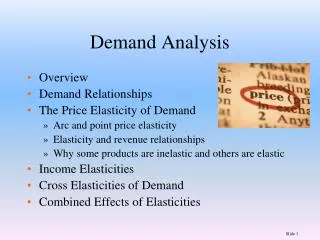
Demand Defined: • Demand. • Desire. • Need. • “ A person when desiring is willing and able to pay for what he/she desires , the desire is changed into demand. • Demand is always: @ Price , Per Unit Time. • Demand refers to the quantity of a good or service that buyers are willing to buy during a particular period at a given price. • Bober’s Definition: “ By Demand we mean the various quantities of a given commodity or a service which consumers would buy in one market in a given period of time at various prices , or at various incomes, or at various prices of related goods”.
Demand Defined::: Contd. • Demand in economics means desire to buy backed by Purchasing Power. Mere wish or desire cannot buy goods. • Seller’s point of view : Demand price is the average revenue or income he expects to earn from the sale of a unit of a commodity. • “Demand price is identical with Average Revenue(AR).”
Types of Demand • Price Demand. • It refers to various quantities of a commodity or service that consumer would purchase at a given time in a market at various hypothetical prices. • It shows the relation between Price & Quantity Demanded. • Income Demand. • It refers to various quantities of a commodity or service that consumer would purchase at a given time in a market at various income levels. • It shows the relation between income & Quantity Demanded. • Cross demand. • It refers to the quantities of a commodity or a service which will be purchased with reference to change in price not of this good but of the inter -related goods. • E.g.: Demand for Tea and Coffee.
Demand Schedule The relationship of Price to Sales or Demand or alternatively , the Price Quantity Relationship , is shown arithmetically in the form of a table showing prices & corresponding quantities. This table is known as Demand Schedule. Demand Schedule
Assumptions of Law of Demand • Income of the consumer is given and constant. • No change in tastes, preference, habits etc. • Constancy of the price of other goods. • No change in the size and composition of • population. These Assumptions are expressed in the phrase “other things remaining equal”.
Demand Curve: “More the price of the commodity or Service less is the quantity demanded and Vice Versa.”
Law of Demand: Statement of the law: • The Law of Demand states that there is an inverse relationship between the price of a good and the quantity demanded of that good (other things being equal) .
Chief Characteristics: • Inverse Relation between Price & Quantity, but may or may not be proportional. • Price an independent variable and Demand a dependable variable. • Other things remain same: it is assumed that there should be no change in other factors ( Income, Substitute’s Price, Consumer’s Tastes & Preferences, Advertising Outlays) influencing demand except price.
Why people buy more when the price falls?or Why Demand curve slopes downwards? • Substitution effect. • Income effect. • Substitution effect: When the commodity becomes cheaper , it tends to be substituted wholly or partly for other commodities. • Income effect: A unit of money goes farther and a consumer can afford to buy more . He is able & willing to purchase the thing being cheaper, his real income increases.
Exceptional Demand Curves • Giffen Paradox: In case of Inferior goods,“Demand is Strengthened with a rise or weakened with a fall in the price”. • Cases of Upward Rising Demand Curve: (Benham); • Serious Shortage . • If Commodity confers distinction.( Conspicuous Consumption). • Ignorance Effect. • If the commodity is a necessity of life.
Demand Curve & Human Behaviour “Man tries to give the least & wants the maximum in return”. “Man tries to weigh between what he is giving & what he is getting in return” Unit of measurement is Money and the Utility. G = what he is giving.(In terms of money). R = what he is receiving .(In terms of goods & their marginal utilities). If G<R, R>G (Trade or exchange goes on). If G=R, (Point where trade stops or Equillibrium Point). If G>R ,(Will there be trade?)
Variations & Changes in Demand Variations in demand refer to those which occur due to changes in the price of a commodity. • Extension of Demand: • This refers to rise in demand due to a fall in price of the commodity. It is shown by a downwards movement on a given demand curve. • Contraction of Demand: • This means fall in demand due to increase in price and can be shown by an upwards movement on a given demand curve.
Graphical Representation ( Variations) Extension (Q to Q2) & Contraction ( Q to Q1) of Demand.
Changes in Demand • Changes in demand imply the rise and fall due to factors other than price. • Increase in Demand: • This refers to higher demand at the same price and results from rise in income, population etc., this is shown on a new demand curve lying above the original one. • Decrease in demand: • It means less quantity demanded at the same price. This is the result of factors like fall in income, population etc. This is shown on a new demand lying below the original one.
Graphical Representation ( Changes) Increase ( D to D1) & Decrease ( D to D2) in Demand
Elasticity of Demand Law of demand explains the functional relationship between price and demand.( Other things Being Equal). The law of demand explains the direction of a change as it states that with a rise in price the demand contracts and with a fall in price it expands. The law of demand fails to explain the extent or magnitude of a change in demand with a given change in price. The law of demand merely shows the direction in which the demand changes as a result of a change in price, but does not throw any light on the amount by which the demand will change in response to a given change in price. The law of demand explains the qualitative but not the quantitative aspect of price- demand relationship.
Elasticity of Demand Contd… It explains the degree of responsiveness of demand to a change in price. It elaborates the price-demand relationship. E.O.D “ means the sensitiveness or responsiveness of demand to a change in price.” According to Marshall, “the elasticity (or responsiveness) of demand in a market is great or small accordingly as the demand changes (rises or falls) much or little for a given change (rise or fall) in price.” Elasticity of demand is a measure of relative changes in the amount demanded in response to a small change in price. Elastic Demand: when a small change in price brings about considerable change in demand. Inelastic Demand : when a change in price fails to bring about significant change in demand.
Equation Ep = Percentage change in quantity demanded / Percentage change in the price.
Perfectly Inelastic Demand This describes a situation in which demand shows no response to a change in price. In other words, whatever be the price the quantity demanded remains the same. It can be depicted by means of the alongside diagram.
Inelastic (less elastic) demand In this case the proportionate change in demand is smaller than in price.
Unitary elasticity (ep = 1) When the percentage change in price produces equivalent percentage change in demand, we have a case of unit elasticity.
Elastic (more elastic) demand. In case of certain commodities the demand is relatively more responsive to the change in price. It means a small change in price induces a significant change in, demand.
Perfectly elastic demand (ep = ∞) This is experienced when the demand is extremely sensitive to the changes in price. In this case an insignificant change in price produces tremendous change in demand.
Determinants of E.O.D • Nature of the Commodity: • The demand for necessities is inelastic and for comforts and luxuries it is elastic. • Number of Substitutes Available: • The availability of substitutes is a major determinant of the elasticity of demand. The large the number of substitutes, the higher is the elastic. It means if a commodity has many substitutes, the demand will be elastic. • Number Of Uses: • If a commodity can be put to a variety of uses, the demand will be more elastic. When the price of such commodity rises, its consumption will be restricted only to more important uses and when the price falls the consumption may be extended to less urgent uses, e.g. coal electricity, water etc.
Determinants of E.O.D ( Contd..) • Range of prices: • The demand for very low-priced as well as very high-price commodity is generally inelastic. When the price is very high, the commodity is consumed only by the rich people. A rise or fall in the price will not have significant effect in the demand. Similarly, when the price is so low that the commodity can be brought by all those who wish to buy, a change, i.e., a rise or fall in the price, will hardly have any effect on the demand. • Proportion of Income Spent: • Income of the consumer significantly influences the nature of demand. If only a small fraction of income is being spent on a particular commodity, say newspaper, the demand will tend to be inelastic. • According to Taussig, unequal distribution of income and wealth makes the demand in general, elastic.
Determinants of E.O.D ( Contd..) • Demand for durable goods, is usually elastic. • The nature of demand for a commodity is also influenced by the complementarities of goods.
Measurement of E.O.D • Percentage Method. • Total Outlay Method.
Percentage Method • In this method, the percentage change in demand and percentage change in price are compared. • ep = [Percentage change in demand / Percentage change in price] • In this method, three values of ‘ep’ can be obtained. Viz., ep= 1, ep > 1, ep< 1. • If 5% change in price leads to exactly 5% change in demand, i.e. percentage change in demand is equal to percentage change in price , e = 1, it is a case of unit elasticity. • If percentage change in demand is greater than percentage change in price, e > 1, it means the demand is elastic. • If percentage change in demand is less than that in price, e < 1, meaning thereby the demand is inelastic.
Total Outlay Method • The elasticity of demand can be measured by considering the changes in price and the consequent changes in demand causing changes in the total amount spent on the goods. • The change in price changes the demand for a commodity which in turn changes the total expenditure of the consumer or total revenue of the seller.
Total Outlay Method ( Contd.) • If a given change in price fails to bring about any change in the total outlay, it is the case of unit elasticity. It means if the total revenue (price x Quantity bought) remains the same in spite of a change in price, ‘ep’ is said to be equal to 1. • If price and total revenue are inversely related, i.e., if total revenue falls with rise in price or rises with fall in price, demand is said to be elastic or e > 1. • When price and total revenue are directly related, i.e. if total revenue rises with a rise in price and falls with a fall in price, the demand is said to be inelastic pr e < 1. • Another suggested by Marshall is to measure elasticity at a point on a straight line is called Point Method
Income Elasticity of Demand • The income effect suggests the effect of change in income on demand. • The income elasticity of demand explains the extent of change in demand as a result of change in income. • In other words, income elasticity of demand means the responsiveness of demand to changes in income. • Income elasticity of demand can be expressed as: EY = [Percentage change in demand / Percentage change in income]
Types of Income Elasticity of Demand • Income Elasticity of Demand Greater than One: • When the percentage change in demand is greater than the percentage change in income, a greater portion of income is being spent on a commodity with an increase in income- income elasticity is said to be greater than one. • Income Elasticity is unitary: • When the proportion of income spent on a commodity remains the same or when the percentage change in income is equal to the percentage change in demand, EY = 1 or the income elasticity is unitary. • Income Elasticity Less Than One (EY< 1): • This occurs when the percentage change in demand is less than the percentage change in income.
Types of Income Elasticity of Demand • Zero Income Elasticity of Demand (EY=o): • This is the case when change in income of the consumer does not bring about any change in the demand for a commodity. • Negative Income Elasticity of Demand (EY< o): • It is well known that income effect for most of the commodities is positive. But in case of inferior goods, the income effect beyond a certain level of income becomes negative. This implies that as the income increases the consumer, instead of buying more of a commodity, buys less and switches on to a superior commodity. The income elasticity of demand in such cases will be negative.
Cross Elasticity of Demand • The demand for a commodity depends not only on the price of that commodity but also on the prices of other related goods. Thus, the demand for a commodity X depends not only on the price of X but also on the prices of other commodities Y, Z….N etc. • The concept of cross elasticity explains the degree of change in demand for X as, a result of change in price of Y. • This can be expressed as: EC = [Percentage Change in demand for X / Percentage change in price of Y]
Cross Elasticity of Demand ( Contd.) • The relationship between any two goods is of two types. The goods X and Y can be complementary goods (such as pen and ink) or substitutes (such as pen and ball pen). • In case of complementary commodities, the cross elasticity will be negative. This means that fall in price of X (pen) leads to rise in its demand so also rise in its demand for Y (ink) . • On the other hand, the cross elasticity for substitutes is positive which means a fall in price of X (pen) results in rise in demand for X and fall in demand for Y (ball pen). • If two commodities, say X and Y, are unrelated there will be no change i. Demand for X as a result of change in price of Y. Cross elasticity in cad of such unrelated goods will then be zero.