Download
1 / 113
1.13k likes | 1.31k Vues
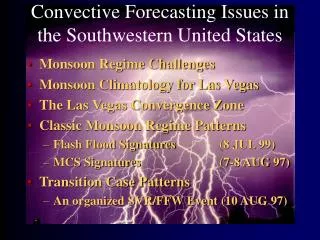
Convective Forecasting Issues in the Southwestern United States. Monsoon Regime Challenges Monsoon Climatology for Las Vegas The Las Vegas Convergence Zone Classic Monsoon Regime Patterns Flash Flood Signatures (8 JUL 99) MCS Signatures (7-8 AUG 97) Transition Case Patterns

E N D
Convective Forecasting Issues in the Southwestern United States • Monsoon Regime Challenges • Monsoon Climatology for Las Vegas • The Las Vegas Convergence Zone • Classic Monsoon Regime Patterns • Flash Flood Signatures (8 JUL 99) • MCS Signatures (7-8 AUG 97) • Transition Case Patterns • An organized SVR/FFW Event (10 AUG 97)
Monsoon Regime Challenges • continual fluctuation between subtropical easterlies and polar westerlies • poor sampling of short waves in easterlies • relatively poor density of surface data • typically low-shear environment (therefore, the primary ingredient = thermodynamics) • storm-relative inflow of buoyant air may be as important as cold pool-shear balance… but usually difficult to assess accurately
The Monsoon Season in Las Vegas Thunderstorm Climatology suggests the “normal season” runs from about July 7 - Sept 11 with peak activity July 15 - August 15
Diurnal Summer Precipitation Frequency Most local thunderstorms occur in the mid to late afternoon with a secondary peak around midnight
Precipitation Amount at LAS Less than 1 percent of the total number of LAS summertime precipitation events exceed 0.25”
2.59” (8/21/57) 1.75” (8/10/42) 1.56” (8/12/79) 1.36” (7/28/84) 1.34” (8/17/77) 1.32” (7/24/56) 1.29” (7/24/55) 1.25” (7/26/76) 3.19” (7/8/99) Blue Diamond Ridge 3.13” (8/10/97) Boulder City 2.24” (9/11/98) Meadow Valley Wash 2.05” (7/19/98) Flamingo Wash 1.89” (9/11/98) California Wash Exceptional Storm Totals At McCarran: Within Clark County:
Surface Dewpoint Trends Dewpoints on thunderstorm days average ~55 F and plateau or rise from late afternoon into evening; non-thunderstorm days normally remain < 45 F and decrease throughout the afternoon.
Surface Dewpoint Trends In contrast to the steady drying observed on non-thunderstorm days, dewpoints tend to rise substantially for 1-2 hours prior to the onset of a mid-afternoon thunderstorm at McCarran.
Surface Dewpoint Trends Similarly, midnight thunderstorms tend to be preceded by a noticeable increase in surface dewpoint during a period when the normal diurnal trend would suggest drying.
Southern Nevada Thunderstorm Days(average morning sounding parameters) • deep, well-mixed elevated boundary layer • 700-500mb lapse rate > 7 C km-1 • surface-700mb theta-w > 17 C (mean mxr > 8 g kg-1) • average 12Z CAPE only about 250-300 J kg-1 • modest deep-layer (0-6km) shear • propagation into valleys dependent on: • mean wind in the cloud-bearing layer • ambient vertical wind shear • bouyancy of the surface inflow layer
Forecasting Problems • DRA often not representative of LV valley • model soundings typically not very valuable • convective structure/evolution sometimes modulated by local circulations • what buoyancy/shear values signal potential for organized convection vs. isolated storms? • how can forecasters assess the influence of storm-relative inflow and internal feedback processes which alter the ambient conditions?
Reflectivity Image of LVCZ Event LV mesonet surface winds superimposed on KESX WSR-88D comp reflectivity, valid 2039 UTC, 30 July 1997.
Purpose of This Study • Reproduce classic LVCZ circulation in numerical simulations • Isolate important processes by systematic variations in wind and thermal profiles • Summarize findings for use in operational convective forecasts
RAMS Simulations • Initial real time simulations failed • grid-scale convection overwhelmed signal • horizontal resolution perhaps too coarse • Subsequent reruns successful • inner nest contracted to 4-km • turned off convection • Sole exception = dry simulation with no diurnal radiation cycle
RAMS Configuration • Non-hyd, 2-way interactive nest (12-km/4-km) • 25 vertical layers, 1-km NCAR terrain • 30-sec time steps, full microphysics • Mahrer-Pielke radiation, no convec. param. • First runs initialized with real data; lateral boundaries nudged toward Eta-29 or RUC • Second runs horizontally homogeneous; modified proximity sounding from DRA
Tilt View of LVCZ Circulation Surface wind vectors and shaded terrain in bottom half of image. (LVCZ highlighted) Potential temperature contours and shaded U-component of wind in upper half of image. (vertical solenoid on lee-side of Mt Chuck highlighted by arrows)
Reflectivity Cross-Section: 2156 UTC (corresponds to time of 67 VIL)
Reflectivity Cross-Section: 2208 UTC (corresponds to 90kt downburst and 1-inch hail 3” deep)
2100 UTC Surface Wind & Convergence with Mean 1-4 km Wind ~ 230/12 ms-1
2100 UTC Surface Wind & Convergence with Mean 1-4 km Wind = 180/07 ms-1
2100 UTC Surface Wind & Convergence with Mean 1-4 km Wind = 310/07 ms-1
Key Factors for Classic LVCZ • Mean wind in the 1-4 km layer AGL: • direction between 200 and 280 degrees • speed less than 10 ms-1 (optimum ~5-7 ms-1) • Deep, well-mixed unstable boundary layer elevated above a shallow, surface-based inversion in the early morning hours • Surface dewpoints > 60 F (PW > 1.00”) • Afternoon CAPE > 1500 J kg-1
Conclusions • The classic LVCZ is the result of an interaction between the ambient wind and a thermally forced mountain-valley circulation under a specified range of prerequisite conditions. • Range of conditions is now understood better and forecaster awareness raised; under such conditions, deep moist convection is likely and potential for explosive growth is substantially increased. • Further study is required to develop more definitive parameters w.r.t. local effects of stability and minimum moisture needed to support deep convection in the Las Vegas valley.
Classic Flash Flood SignaturesIllustrative Case: July 8, 1999
Organized Severe Storms Illustrative Cases: August 7-8, 1997