Download
1 / 50
500 likes | 666 Vues
Future Outlook for Air Quality Forecasting in the United States. Real Time Air Pollution Data Exchange and Forecast Workshop Copenhagen, Denmark April 7-8, 2005 Gary Foley, Director, USEPA, National Exposure Research Laboratory. Presentation Overview.

E N D
Future Outlook for Air Quality Forecastingin the United States Real Time Air Pollution Data Exchange and Forecast Workshop Copenhagen, Denmark April 7-8, 2005 Gary Foley, Director, USEPA, National Exposure Research Laboratory
Presentation Overview • U.S. motivation in linking air pollution to health • US National Ambient Air Quality Standards are health based. • EPA’s Report on the Environment • Center for Disease Control - National Environmental Public Health Tracking Network • PHASE Project • EEA/US EPA ecoinformatics test bed • Current data sources and their challenges • Ambient monitoring • Air quality modeling • Satellite data • Current data assimilation research • Fusing modeling and ambient data • Satellite interpolation • Future directions
EPA’s Draft Report on the Environment 2003 • Measuring the success of policies and programs to protect health and the environment (Accountability) • Describes what EPA knows - and doesn’t know • Identifies measures/indicators to report on the status and trends and, where possible, their impacts on human health and the environment; and, • Discusses the challenges that the nation faces in improving these measures.
What does the Report on the Environment say about Air? • “In general, there are some very good measures of outdoor air quality.” • However . . . “There is a need for measures to compare actual and predicted human health and ecological effects related to exposure to air pollutants.”
Indicators Level 1 Actions by EPA, State, and other regulatory agencies Level 2 Actions and behavioral changes by regu-lated com-munity Level 3 Reduced amount or toxicity of emissions Level 4 Improved ambient conditions Level 5 Reduced exposure or body burden Level 6 Improved Human or ecological health Data Available Data Unavailable at present Time Measures of Human/Eco- Health Response Output Measures Indicators
The Public Health Air Surveillance Evaluation (PHASE) Project • Collaboration between the US EPA and the Centers for Disease Control (CDC) • Develop and evaluate alternative air quality characterization methods for environmental public health tracking • Air Pollutants • Ozone and Particulate Matter • Health Endpoints • Asthma and Cardio Vascular Disease • Working with 3 CDC State Partners • Maine • New York • Wisconsin
PHASE Objectives • Provide enhanced air quality information for use in Environmental Public Health Tracking • Supplement the ambient air monitoring network data with emerging data sources • Satellites • Air Quality Modeling (Forecasts) • Improved spatial and temporal coverage • Use statistical techniques to “combine” data from the various sources • Reduce uncertainty in monitoring gaps • Produce information that can be ROUTINELY used to track potential relationships between public health and air quality
European Environment Agency - US EPA Ecoinformatics Cooperation Test bed project • Evaluate the value and utility of advanced metadata management and semantic concept management • Result of Brussels, September 2004 meeting • Air quality and human health outcomes first subject area • EEA focus • Ljubljana, Slovenia and Leicester, U.K. • U.S. focus • Two eastern cities to be determined • Federal, state, public/private partnerships • Air accountability framework development and testing
The Air Quality Characterization Challenge and Steps Being Taken in the U.S. • Issue: Cannot monitor at all locations, but want to know air pollution characteristics and concentrations everywhere. • To better evaluate air quality attainment directly • To better relate to health and environmental improvements • Solution: Combined predictive approaches taking advantages of different data strengths
Sources of Air Quality Characterization / Concentration Information • Ambient air monitoring data • Air quality modeling output (e.g. CMAQ) • Satellite data (e.g. MODIS)
Modeling Satellite Partnerships in Characterizing Air Quality Monitoring
Ambient Air Monitoring • True measure of air quality • Spatial and Temporal Gaps • Routinely available information
Satellite Data • Emerging source of data(1-10 km grids) • Spatial and Temporal Gaps • Algorithm uncertainties(clouds) • Routinely available data
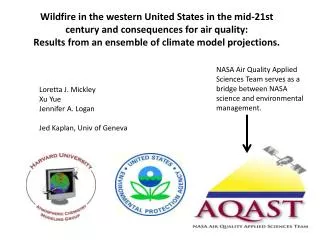
Can Satellite Data help assess influences of large wildfires on surface PM2.5 for public health assessments? Alaskan Fire Complexes June 30, 2004 Data source: NASA MODIS-Aqua
Regional PM2.5 Composition Measurementsfor Carbon and Sulfate in US Midwest States Increase Carbon Mass in In-situ Speciation Trends Network indication of Alaskan Fire Influences on Regional Concentrations surface PM2.5.
12 September 2002 Linear Interpolation Surface PM2.5 Monitors MODIS AOD Satellite measurements capture important spatial gradients and meteorology influences, extremely important for public health side of air quality.
Air Quality Modeling • Estimate of air quality levels • Good spatial and temporal coverage • Air Quality Forecasting • Emerging source of routine data
The Community Multiscale Air Quality Model (CMAQ) • Developed in EPA’s Office of Research and Development (ORD) • Reflects State-of-the-Science • “One atmosphere" model • Treats multiple pollutants simultaneously at several spatial and temporal scales • regional to urban to “neighborhood” scales • tropospheric ozone, fine particles, air toxics, acid deposition, and visibility.
CMAQ Components • Emissions Model • Man-made and natural emissions into the atmosphere • Meteorological Model • Description of atmospheric states and motions • Chemical Transport Model • Simulation of chemical transformation, transport and fate in the atmosphere
CMAQ Modeling System Fifth Generation Mesoscale Model (MM5) (WRF in 2005) NOAA Weather Observations EPA Emissions Inventory Met-Chem Interface Processor (MCIP) Met. data prep SMOKE Anthro and Biogenic Emissions processing CMAQ AQ Model- Chemical-Transport Computations Hourly 3-D Gridded Chemical Concentrations
CMAQ Applications • Current applications • Air Quality Planning • National Air Toxics Assessments • Fine or “neighborhood” scale modeling for exposure assessment • Emerging applications • Air Quality Forecasting • Air Pollution Climatology Connection to Environmental Public Health Tracking
Air Quality Forecasting another linkage of air quality characterization and public health • Current applications of air quality models in the regulatory framework do not generate routinely available modeling results. • However, the EPA-NOAA Air Quality Forecasting applications will generate routinely available data on various pollutants on different temporal and spatial scales.
AQI: Peak Aug 22 EPA Monitoring Network National Air Quality Forecast CapabilityInitial Operational Capability (IOC) Linked numerical prediction system Operationally integrated on NOAA/NWS’s supercomputer • NWS mesoscale model: Eta-12 • NOAA/EPA community model for AQ: CMAQ Observational Input: • NWS weather observations • EPA emissions inventory Gridded forecast guidance products Delivered to NWS Telecommunications Gateway and EPA for users to pull 2x daily Verification basis EPA ground-level ozone observations Customer outreach/feedback State & Local AQ forecasters coordinated with EPA Public and Private Sector AQ constituents
7/21/04: 8-hour Peak Ozone Forecast Observed 7/22/04: 8-hour Peak Ozone Forecast Observed Forecast and Observed Surface Ozone Distributions
National Air Quality ForecastingPlanned Capabilities Current: 1-day forecast guidance for ozone • Developed and deployed initially for Northeastern US, September 2004 • Deploy Nationwide by 2009 Intermediate (5-7 years): • Develop and test capability to forecast particulate matter concentration • Particulate size < 2.5 microns Longer range (within 10 years): • Extend air quality forecast range to 48-72 hours • Include broader range of significant pollutants
Current PHASE Project • First attempt at routine association of air quality and public health indicators • Collaboration of US EPA and CDC, and 3 CDC State partners; Maine, New York, and Wisconsin • Demonstrate use of spatial prediction using combined sources of data • Ambient air monitoring data (PM2.5 and O3) • Air quality numerical model output • Satellite data, e.g. MODIS aerosol optical depth
Approach in Fusing Monitoring Data and Modeling Outputs • Monitoring data and model output can be used simultaneously to predict the pollutant surface • Draw on strengths of each data source: • Give more weight to precise monitoring data in areas where monitoring exists • Rely on model output in non-monitored areas • Model underlying spatial dependence and measurement errors of each source • “Blind Combining” increases likelihood of incorrect decisions • Leads to more accurate predictions and prediction errors
Current work combining monitoring , modeling, and satellite data • Combining monitoring data with CMAQ output; two approaches - Adjusting model outputs with monitoring data(annual, species specific) - Fusing data sets with Bayesian techniques(daily, pollutant concentrations for PHASE) • Improved air quality “surface.” • Considerably lower spatial interpolation errors • Satellite observations show potential for aerosol spatial predictions
Adjusted CMAQ model estimates of SO4 particulate (μg/m3) for July 2001. Observed values are used to offset model biases. Original CMAQ model estimates of SO4 particulate (μg/m3) for July 2001. Observed values are indicated, but model results are not influenced by them.
Daily 8-hr Maximum O3 (ppb) June 8, 2001NAMS/SLAMS Monitoring Data and CMAQ
Daily PM2.5 Concentration (ug/m3) Sept. 12, 2001 EPA FRM Monitoring Data and CMAQ
Combined Model Validation using Daily STN PM2.5 Monitoring Data • For each day of 2001: • Use combined Bayesian approach based on CMAQ and FRM data to predict PM2.5 at STN sites • Use standard kriging approach based on FRM data to predict PM2.5 at STN sites • Calculate root mean squared prediction error (RMSPE) for each approach • RMSPE = square root{sum of squared (prediction-STN) differences across all sites} • Calculate and compare RMSPE for each prediction approach
EPA is Prototyping Algorithms that Use Aerosol Optical Depth in Spatial Predictions Spatial Interpolation Service Illustration Slide
? Linking Air Quality and Public Health? • Do different air quality characterization methods improve capabilities for environmental public health tracking?
Percent increase in monthly mortality per increase in 1 µg/m3 of PM2.5 concentrations (June, 2000).
Change in monthly percent increase in mortality by adding ozone predictive surface
PHASE Process • EPA has provided CDC State partners with alternative measures to characterize air quality (End of 2004) • Ambient monitoring • Air quality modeling • Satellite data • Combinations of the above • State partners “link” the alternative measures to available health surveillance data (Early 2005) • Evaluate and compare the use various air quality characterization methods (End of 2005)
ES&T Nov 2003 “Accountability Within New Ozone Standards”, ES&T, Nov. 1, 2003 Today, it is possible to • Model of Population Exposures changes likely to result from AQ Control Measures • Design Accountability Programs that measure actual changes
New 8 hour O3 Std 80 ppm 90 million people exposed to levels at or above the standard Old 1 hour O3 Std 120 ppm 5 million people exposed to levels at or above the standard
Future Analyses • Assess improved predictive ability by including MODIS satellite data • Combining monitoring, modeling, and satellite data into fused air quality surface • Summer 2005 • Extend fused surface validations to other independent networks • IMPROVE (PM2.5) and CASTNet (rural O3) • 2005 • Conduct sensitivity analysis • Compare surfaces using 12km vs 36 km CMAQ grids • 2005-6
Summary • EPA is seeking better ways to measure the ultimate success of its regulatory programs. • CDC’s Environmental Public Health Tracking program is seeking compatible air quality data to inform public health actions. • There are new possibilities for improving the way we characterize air quality and exposure. • EPA is building partnerships with public and private sectors • EPA is building a database of high-resolution spatial maps of air quality over the U.S. • EPA would like to work with EU in exploring the linkage between better air quality indicators and forecasts and human exposure and health.