Download

1 / 7
70 likes | 165 Vues
Explore dropout rates and college participation statistics for Mott Middle/Early College from 1992 to 2007. Discover key data on school operations, student enrollments, course credits, and academic performance.

E N D
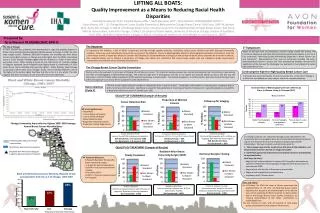
Drop Out StatisticsThe graph shows the overall dropout rates each year for Mott Middle/Early College beginning in 1992.
HIGHLIGHTS & FACTS2006-2007 ♦ 13 operating schools (9 redesigns, 4 new) ♦ 7 states represented NY, CA, MI, TN, SC, CO, KY ♦3,866 students served College Participation ♦63% of all students were enrolled in college courses ♦34% of 9th graders were enrolled in college courses ♦79% of 12th graders were enrolled in college courses
College CourseEnrollments & Credits (Fall '02 to Summer '07) • 24,523 = Total number of cumulative course enrollments • 49,787 = Total number of cumulative earned credits • 9th graders accumulated an average of 9 credits • 10th graders accumulated an average of 15 credits • 11th graders accumulated an average of 22 credits • 12th graders accumulated an average of 31 credits College Performance • 92% course pass rate • 2.78 average cumulative college GPA