Download
1 / 53
530 likes | 670 Vues
Included is the set of slides as discussed on April 20, which had not been distributed completely. This is followed by slides (from #21) discussing the (surprising) phloem metabolite analysis. Our discussion went further, to slide 29/30. Metabolomics, spring 06. Hans Bohnert ERML 196

E N D
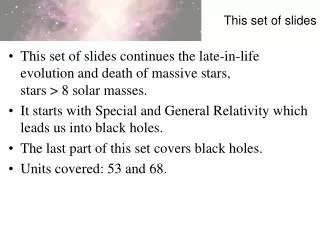
Included is the set of slides as discussed on April 20, which had not been distributed completely. This is followed by slides (from #21) discussing the (surprising) phloem metabolite analysis. Our discussion went further, to slide 29/30.
Metabolomics, spring 06 Hans Bohnert ERML 196 bohnerth@life.uiuc.edu 265-5475 333-5574 http://www.life.uiuc.edu/bohnert/ class April 20 Metabolomics Essentiality Today’s discussion topic (single cell profiles) Fan TWM, Bandura LL, Higashi RM, Lane AN (2005) Metabolomics-Edited Transcriptomics Analysis of Se anticancer action in human lung cancer cells. Metabolomics 1, 325. Fiehn O (2003) Metabolic Networks of Cucurbita maxima phloem. Phytochemistry 62, 875-886. Zhang B (2006) Dissection of Phloem Transport in Cucurbitaceae by Metabolomic Analysis. PhD thesis, MPI-Golm
What NMR signals mean chemical shift imprinted by neighboring nuclei characteristic for each bond compare signals with a library of known signals 1,3-butanediol two-dimensional (change field by 90o repeated scans at different frequencies) • quartet • doublet • triplet • triplet one-dimensional
Chemical shift is usually expressed in parts per million (ppm) by frequency, • because it is calculated from: • Sincethe numerator is usually in hertz, and the denominator in megahertz, • delta is expressed in ppm. • The detected frequencies (in Hz) for 1H, 13C, and 29Si nuclei are usually referenced • against TMS (tetramethylsilane), which is assigned the chemical shift of zero. • Other standard materials are used for setting the chemical shift for other nuclei. • The operating frequency of a magnet is calculate from the Larmor equation: • Flarmor = γ * B0, where B0 is the actual strength of the magnet, • in units like Tesla or Gauss, and • γ is the gyromagnetic ratio* ofthe nucleus being tested. *the ratio of the magnetic dipole moment to the angular momentum of an elementary particle.
Fan, Bandura, Higashi & Lane (2005) Metabolomics 1, 325-339 Metabolomics-edited transcriptomics analysis of Se anticancer action in human lung cancer cells (META) Transcriptomic analysis is an essential tool for systems biology but it has been stymied by a lack of global understanding of genomic functions, resulting in the inability to link functionally disparate gene expression events. Using the anticancer agent selenite and human lung cancer A549 cells as a model system, we demonstrate that these difficulties can be overcome by a progressive approach which harnesses the emerging power of metabolomics for transcriptomic analysis. We have named the approach Metabolomics-edited transcriptomic analysis (META). The main analytical engine was 13C isotopomer profiling using a combination of multi-nuclear 2-D NMR and GC-MS techniques. Using 13C-glucose as a tracer, multiple disruptions to the central metabolic network in A549 cells induced by selenite were defined. META was then achieved by coupling the metabolic dysfunctions to altered gene expression profiles to: (1) provide new insights into the regulatory network underlying the metabolic dysfunctions; (2) enable the assembly of disparate gene expression events into functional pathways that was not feasible by transcriptomic analysis alone. This was illustrated in particular by the connection of mitochondrial dysfunctions to perturbed lipid metabolism via the AMP-AMPK pathway. Thus, META generated both extensive and highly specific working hypotheses for further validation, thereby accelerating the resolution of complex biological problems such as the anticancer mechanism of selenite. Key words (3-6) two-dimensional NMR; GC-tandem MS; 13C isotopomer profiling; selenite; lung adenocarcinoma A549 cells. Abbreviations 1H–13C HMBC: 1H–13C heteronuclear multiple bond correlation spectroscopy; 1H–13C HSQC: 1H–13C heteronuclear single quantum coherence spectroscopy; 2-D 1H TOCSY: two dimensional 1H total correlation spectroscopy; [U)13C]-glucose: uniformly 13C-labeled glucose; MSn: mass spectrometry to the nth dimension; MTBSTFA: N-methyl-N-[tert-butyldimethylsilyl]trifluoroacetamide; P-choline or PC: phosphorylcholine; PDA: photodiode array; TCA: trichloroacetic acid.
Knowledge: Se is an essential atom, high amounts affect (cancer) growth, Se in proteins is related to ROS homeostasis (somehow!) Experiment: The addition of Se to lung cells affects growth – what is the basis? Use genomics platforms (transcript analysis), GC-MS & esp. NMR Hypothesis: gene expression is altered, and metabolite analysis can be correlated with transcript changes – can it, is the question! Approaches Microscopy, NMR, GC-MS, transcripts
Se interferes with the cytoskeleton and mitochondrial activity apoptosis Selenite effects proliferating cells; Selenite-rich diets may have anti-cancer applications. dye: mito-tracker
Se leads to apoptosis/degradation of DNA TUNEL assay? terminal dUTP nick-end labeling control Se treated
* * “1H chemical shift” High resolution 1D NMR spectra of control and Se-treated cells Next slide – convert to 2D representation of differences in shift
Metabolites with chemical shift indicative of changes 12C/13C and 1H connectivity boxes trace 1H connectivity of 13C-labeled C Se-cells (13C-glc) spectral differences control/Se
Confirmation of putative changes Additional use of HPLC/UV spectroscopy for substances in crowded regions of the NMR spectra (adenine/uracil nucleotides, NAD/NADP, aromatic amino acids)
GC-MS + NMR absolute amount labeled positions (12C-13C)
From enrichment / incorporation deduce pathways – e.g., P-choline, cysteine in GSH, or methionine can be recognized whether from medium (13C) or from internal turnover/stores.
high resolution Control 1D Control 2D boxes trace 1H connectivity of 13C-labeled C
down up *depletion 13C
Metabolomics, spring 06 Hans Bohnert ERML 196 bohnerth@life.uiuc.edu 265-5475 333-5574 http://www.life.uiuc.edu/bohnert/ class April 25 Metabolomics Essentiality Today’s discussion topic Fiehn O (2003) Metabolic Networks of Cucurbita maxima phloem. Phytochemistry 62, 875-886. Zhang B (2006) Dissection of Phloem Transport in Cucurbitaceae by Metabolomic Analysis. PhD thesis, MPI-Golm Schauer N, Zamir D, Fernie, AR (2005) Metabolic profiling of leaves and fruit of wild species tomato: a survey of the Solanum lycopersicum complex. J Exp Bot. 56: 297-307. Schauer N, Semel Y Roessner Um Gur A, Balbo I, Carrari F, Pleban T, Perez-Melis A, Bruedigam C, Kopka J, Willmitzer L, Zamir D, Fernie AR (2006) Comprehensive metabolic profiling and phenotyping of interspecific introgression lines for tomato improvement. Nat Biotechnol. 24: 447-454.
What we discussed so far • metabolomics technologies • GC-MS profiling – six steps: • extraction – derivatization – separation – • ionization – detection – acquisition/evaluation • relative advantages of different technologies (LC, GC, TOF, MS-MS, NMR) • challenges: • automation – analytic scope – trace compound calling - reproducibility • and quantitative comparisons across platforms – • size and complexity of metabolite libraries • plant volatiles – tri-trophic interactions • static vs. dynamic metabolite profiling; • stable isotopes - flux determinations • sugars to fatty acids (Rubisco in green seeds), TPs to amino acids • integration of transcriptomics and metabolomics • the cold-metabolome – certainty from highly variable datasets (ecotypes/lines) • cell-specific reactions [animal] (how can we use plant cell cultures?) • long-distance transport metabolomics • metabolomics – transcriptomics – QTLs (tomato – wild tomato crosses) • towards systems understanding • discussion still to come
Phloem transport as a metabolomics topic sink 1 symplastic apoplastic mixed source sink 2 Oliver Fiehn, 2003 Baichen Zhang, 2006 Pressure flow concept
hydraulic connectivity transporters directionality phloem metabolic activity? Too simple?
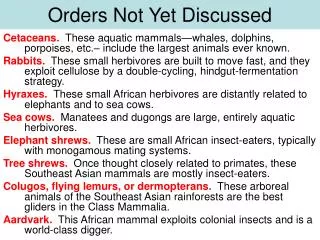
stem major/minor veins monocot – dicot bacterial contributions (e.g., Rhizobia)
Types of companion cells We are far from understanding cell-specificity
Comparison phloem/xylem exudate – leaf Phloem exudates are very different from leaf profiles - no reducing sugars in phloem
Polymer trapping concept What polymers?
An osmotically “neutral” transport form of sucrose Galactinol synthase as the rate-limiting enzyme Raffinose/ stachyose synthases catalyze reversible reactions
high MW O - linked glycans leaf discs accumulate RFO sugars RFO – Raffinose Family Oligosacch. verbascose Hydrophilic Interaction Liquid Chromatography (HILIC) – Ion Trap (IT) - MS
Labeling of O-glycans (C52H1NO42) M0 (M+H)+ = 1402 m/z
contents of phloem exudates are species-specific
How viable are “older” studies? Or Do textbooks tell the real story?
Morphology of cucurbit vasculature
Fluorescein (CF5) labeling of “active” phloem short-/long-term
stem phloem exudate Central phloem tissue (TIC) Identification & relative amount of metabolites in (b) (GC-MS)
phloem exudate collected dissected central phloem tissue glycan
Distinguishing tissues by metabolites pith cortex dissected xylem acids/amino acids
Stem phloem exudate Central phloem tissue Selected metabolites Relative amounts
PCA grouping of samples
Phloem is not just transport - is metabolically active
Labeling of amino acids in phloem exudates (petiole collection) and leaf discs
PCA Data from phloem snapshots A clearly individualistic streak! some correlations
Metabolic correlation networks Pair-wise computation of Pearson correlations for individual leaves Nodes mark individual metabolites connected with others in clusters P – plant L - leaf