Download

1 / 30
300 likes | 546 Vues
Energy and climate change. Facts and Trends to 2050. WBCSD, November 2004. Facts and trends. The issue at a glance. Growth, development & energy demand Energy is the fuel for growth, an essential requirement for economic and social development.

E N D
Energy and climate change Facts and Trends to 2050 WBCSD, November 2004
Facts and trends The issue at a glance . . . Growth, development & energy demand • Energy is the fuel for growth, an essential requirement for economic and social development. • Energy demand could double or triple by 2050 as a result of development. Energy use and climate impacts • Carbon dioxide levels in our atmosphere are rising, as is global temperature. • By starting to manage carbon dioxide emissions now, we can limit the change. The dynamics of technological change • Global technological change is a lengthy process, measured in decades. • Very large systems such as transport and energy infrastructures can take up to a century to fully develop. Reshaping our energy future • By 2050 energy demand will be sharply higher, but global carbon emissions must be no higher than today and trending downward. • No single solution will deliver this change. • Above all, we need to start now.
Facts and trends - section 1 The issue at a glance . . . Growth, development & energy demand • Energy is the fuel for growth, an essential requirement for economic and social development. • Energy demand could double or triple by 2050 as a result of development. Energy use and climate impacts • Carbon dioxide levels in our atmosphere are rising, as is global temperature. • By starting to manage carbon dioxide emissions now, we can limit the change. The dynamics of technological change • Global technological change is a lengthy process, measured in decades. • Very large systems such as transport and energy infrastructures can take up to a century to fully develop. Reshaping our energy future • By 2050 energy demand will be sharply higher, but global carbon emissions must be no higher than today and trending downward. • No single solution will deliver this change. • Above all, we need to start now.
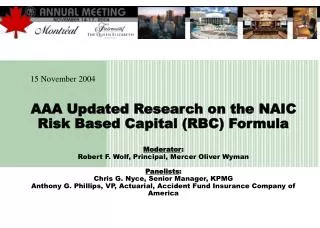
How will our energy systemdevelop? 8000 0.4 Temperature variation(w.r.t. 1961-1990) Global CO2 emissions from fossil fuel use, MtC 6000 0.2 The transition is uncertain? CO2 emissions High Temperature variation 4000 0.0 2000 -0.2 0 -0.4 Low New renewables such as wind and solar Source: Hadley Centre and CDIAC Development of oil, gas and large-scale hydro, introduction of nuclear. Coal economy 1920-1930’s 2000 2050 OECD countries Non-OECD countries 1200 1000 800 Primary, Energy, EJ 600 400 200 0
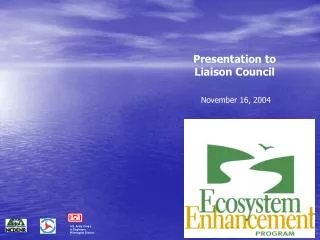
Global Trend EU-15 North America Korea 1970-2000 Malaysia 1970-2000 China 1970-2000 Growth, development and energy demand Basic premise – energy use and growth are strongly linked 400 350 300 250 200 Energy Use, GJ per capita 150 100 50 Source: WBCSD adaptation of IEA 2003 0 $0 $5'000 $10'000 $15'000 $20'000 $25'000 $30'000 GDP per capita, US$ 1995 ppp
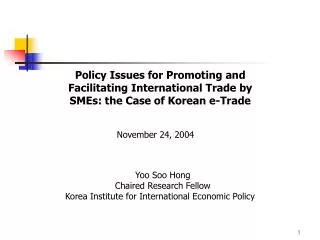
Primary energy Developed (GDP>$12,000) Emerging (GDP<$12,000) Developing (GDP<$5,000) Poorest (GDP<$1,500) Population expected to rise to 9 billion by 2050, mainly in poorest and developing countries. 10000 8000 Shifting the development profile to a “low poverty” world means energy needs double by 2050 6000 4000 Shifting the development profile further to a “developed”world means energy needs triple by 2050 2000 0 Base case Low Poverty Prosperous world Growth, development and energy demand • Global population divided into income groups: • Poorest (GDP < $1,500) • Developing (GDP < $5,000) • Emerging (GDP < $12,000) • Developed (GDP > $12,000) Population, millions Source: WBCSD adaptation of IEA 2003 2000 2050
Canada Russia USA 20’000 10’000 UK Germany Japan Poland France China Venezuela Pakistan 5000 India Australia Brazil Nigeria Indonesia South Africa Mozambique Other sectors OECD Non-road transport Road transport World Manufacturing Non-OECD Energy industries Heat and power Energy use, development and CO2 Source: WBCSD adaptation of IEA 2003 Emissions by sector, kg CO2 per capita per year (2001)
India (C, H) South Africa (C) Australia ( C, G) China (C, H) Indonesia (G, O, C, H) Poland (C, G) USA (C, G, N) Germany (C, G, N) Pakistan (G, H) UK (G, N, C) Netherlands (G, C) Nigeria (O, G, H) Japan ( G, N, C, H) Denmark (G, C, W) Russia (G, C, H, N) Mozambique (H) Venezuela (H, G) Canada (H, C, G, N) New Zealand (H, G, Ge) Brazil (H) France (N, H) Iceland (H, Ge) Energy use, development and CO2 Power generation emissions gCO2/kWh 1000 Coal > Oil > 800 Source: WBCSD adaptation of IEA 2003 and CIA 2004 600 Gas > 400 200 Geothermal Nuclear Hydro Wind > 0 Diversity of fuel sources
Facts and trends - section 2 The issue at a glance . . . Growth, development & energy demand • Energy is the fuel for growth, an essential requirement for economic and social development. • Energy demand could double or triple by 2050 as a result of development. Energy use and climate impacts • Carbon dioxide levels in our atmosphere are rising, as is global temperature. • By starting to manage carbon dioxide emissions now, we can limit the change. The dynamics of technological change • Global technological change is a lengthy process, measured in decades. • Very large systems such as transport and energy infrastructures can take up to a century to fully develop. Reshaping our energy future • By 2050 energy demand will be sharply higher, but global carbon emissions must be no higher than today and trending downward. • No single solution will deliver this change. • Above all, we need to start now.
RE RE RE IPCC B2, the lower energy use scenario, represents an intermediate level of economic growth with an emphasis on local solutions to sustainable development. In this world there is less rapid but more diverse technological change. IPCC A1B, the higher energy use scenario, describes a future world of very rapid economic growth and the rapid introduction of new and more efficient technologies. 1500 Using the IPCC scenarios Renewables Primary energy, EJ per year • IPCC developed many scenarios, each with several models. • A1B and B2 were consistent on population and development goals with “Low Poverty” and “Prosperous World” case. • A1B-AIM and B2-AIM used in this publication. Biomass 1000 Nuclear Natural gas 500 Oil Coal Source: IPCC 2000 B2 A1B 2000 2050
1000 ppm Risks to many Risks to some Large Increase Increase Higher Very Low 550 ppm 1000 ppm 2100 2300 450 ppm 2100 2300 2100 2300 550 ppm 450 ppm Scenario A1B emissions range Scenario B2 emissions range Unique and threatened systems Extreme climate events Large-scale high-impact events Is there an acceptable limit for CO2 emissions? Is there an acceptable limit for CO2 emissions? CO2, GtC ºC 6 - 5 - 4 - 3 - 2 - 1 - 0 - 25 20 15 10 5 1990 0 1980 2000 2020 2040 2060 2080 2100 Source: IPCC 2001
Adapting to climate change The impact on our climate could be substantial even at an achievable stabilizationlevel, so adaptation to climate change will have to play a part of any futurestrategy. Impacts will vary from region to region; much of the detail is uncertain. • Measures might include: • Flood defences in low-lying areas, ranging from Florida to Bangladesh • Refugee planning for island states such as the Maldives • Improved water management (e.g. aqueducts) as rainfall patterns change
Facts and trends - section 3 The issue at a glance . . . Growth, development & energy demand • Energy is the fuel for growth, an essential requirement for economic and social development. • Energy demand could double or triple by 2050 as a result of development. Energy use and climate impacts • Carbon dioxide levels in our atmosphere are rising, as is global temperature. • By starting to manage carbon dioxide emissions now, we can limit the change. The dynamics of technological change • Global technological change is a lengthy process, measured in decades. • Very large systems such as transport and energy infrastructures can take up to a century to fully develop. Reshaping our energy future • By 2050 energy demand will be sharply higher, but global carbon emissions must be no higher than today and trending downward. • No single solution will deliver this change. • Above all, we need to start now.
All change tomorrow? • Many advocate that a rapid change inour energyinfrastructure is the only solution to the threat ofclimate change. However: • Major transitions at the global level will take time to implement • The speed with which new technologies diffuse depends on many factors.
1946: ENIAC unveiled 1964: IBM 360 1972: Xerox GUI and mouse 1982: IBM PC 2000:Cheap high speed computing 1991: www convention adopted 1990: Number of hosts exceeds 100’000 1983: Switch-over to TCP/IP 1972: @ first used 1969: ARPANET commissioned by DoD for research into networking 1961: First paper on packet-switching theory Evolution of the Internet Dot.com boom: explosive growth of the internet, acceptance as an everyday part of life 1940 1950 1960 1970 1980 1990 2000 1943: “I think there is a world market may be for six computers” Thomas Watson, Chairman, IBM
Buildings 45+++ years Hydro75+ years Coal power 45+ years Nuclear 30 – 60 years Gas turbines 25+ years Motor vehicles 12 – 20 years The lifetime of energy infrastructure The rate of technological change is closely related to the lifetime of the relevant capital stock and equipment 5 10 15 20 25 30 35 40 45 50 55 60 65 70 75 80 ++
Production at 1000 cars/month 1 million per annum produced Production ends in Germany Last vehicles on the road in the EU Production ends in Mexico First concept First prototype 1 million produced 16 million produced 21.5 million produced « Technology transfer »? New technologies in developed countries may arrive, mature and even decline before their widespread adoption in developing regions. Last vehicles on the road? 1930 1940 1950 1960 1970 1980 1990 2000 2010 2020
Total alternative vehicles Total traditional vehicles Annual total vehicle growth of 2% p.a. Annual vehicle production growth of 2% p.a. Case 1: Light duty vehicles Total vehicles, millions 2500 2000 1500 1000 500 Large scale "alternative" vehicle manufacture starts in 2010 with200,000 units per annum and grows at 20% p.a. thereafter. 0 2000 2010 2020 2030 2040 2050
… CO2 emissions from the power sector will still not start to decline before 2030 Additional capacity needed CO2 emissions Mt per year Declining current capacity 10’000 Even if… 9’000 • All new coal stations capture and store carbon or nuclear/ renewable capacity is built instead • Natural gas is the principal other fossil fuel 8’000 Case 2: Power generation technologies Global installed generation capacity GW 8000 6000 4000 2000 . . . because of the large existing base of power stations and their long lifetimes 0 1999 2010 2020 2030
Facts and trends - section 4 The issue at a glance . . . Growth, development & energy demand • Energy is the fuel for growth, an essential requirement for economic and social development. • Energy demand could double or triple by 2050 as a result of development. Energy use and climate impacts • Carbon dioxide levels in our atmosphere are rising, as is global temperature. • By starting to manage carbon dioxide emissions now, we can limit the change. The dynamics of technological change • Global technological change is a lengthy process, measured in decades. • Very large systems such as transport and energy infrastructures can take up to a century to fully develop. Reshaping our energy future • By 2050 energy demand will be sharply higher, but global carbon emissions must be no higher than today and trending downward. • No single solution will deliver this change. • Above all, we need to start now.
. . . about 700 conventional 1GW coal fired power stations . . . about 1400 1GW CCGT power stations . . . about 600 million SUVs . . . or more than one and a half billion hybrid- electric vehicles One Giga-tonneof carbon emissions per year?
Direct burning of fuel 3-4 Gt Final Energy Non-commercial 8 Gt carbon 800 million vehicles 1+ Gt Solids Liquids 700+ coal power stations 1.5 Gt Gas Electricity 1 Gt Non-commercial biomass 309 EJ 800 gas or oil power stations 0.7 Gt Non emmitting technologies 0 Gt 8.0 Gt 25EJ per year solar 500,000 5MW wind turbines 1000 1GW coal power stations 1000 1GW coal stations with sequestration 1000 1GW oil power stations 1000 1GW gas power stations 1000 1GW nuclear plants 1000 1GW hydro/ tidal /geothermal 500 million vehicles (Biofuels) 500 million low CO2 (Biofuels) 50EJ non-commercial fuel 100 EJ direct fuel use (Biofuels) Today’s energy infrastructure 2000
Meeting future energy needs(IPCC) 16 Gt carbon Final Energy Non-commercial 15 Gt carbon Solids Liquids Gas Electricity Rapid economic growth and rapid introduction of new and more efficient technologies. 1002 EJ Intermediate growth, local solutions, less rapid technological change. 671 EJ 2050 (B2-AIM) 2050 (A1B-AIM)
A1B/B2 Emissions range 1000 ppm 550 ppm 6-7 Gt reduction Achieving an acceptable CO2 stabilization Achieving a lower CO2 stabilization 30 CO2emissions GtC / year 25 20 • A1B-AIM • B2-AIM 15 10 5 0 Source: IPCC 2000 2000 2020 2040 2060 2080 2100
A much lower CO2 trajectory Final Energy Non-commercial 9 Gt carbon Solids Liquids Gas Electricity 705 EJ Low energy / carbon intensity development, enabled by societal and technology changes. 2050 (550 ppm trajectory)
16 Gt 1002 EJ 8 Gt 9 Gt 15 Gt Rapid economic growth and rapid introduction of new and more efficient technologies. 705 EJ Intermediate growth, local solutions, less rapid technological change. Low energy / carbon intensity development, enabled by societal and technology changes. 671 EJ 309 EJ 2050 (A1B-AIM) 2050 (B2-AIM) 2000 2050 (550 ppm trajectory) Some options at a glance
Scenario B1 emissions range 1000 ppm 550 ppm Energy conservation and efficiency CO2 emissions GtC/year 20 15 10 5 Source: IPCC 2000 0 2000 2020 2040 2060 2080 2100
Renewables Wind, solar, geothermal, hydroelectricity. e.g. 300,000 5 MW wind turbines is equivalent to 1 Gt carbon from conventional coal, but would cover Portugal! Mass transportation CO2 emissions per person vary over a 3:1 range for developed countries – mass transit is one of the reasons. Low energy appliances 0.5 – 1 Gt carbon reductions could be achieved by 2050 just by changing the lights!! A further shift to natural gas 1400 1 GW CCGT rather than 700 conventional coal fired plants means 1 Gt less carbon emissions per annum. Carbon capture and storage A possible route to using our abundant coal resources, but numerous implementation challenges remain. Buildings The US DOE Zero Energy Home program has shown that a 90% reduction in energy can be achieved for new. buildings. Bio-products By 2050, bio-products could contribute 100 EJ of final energy with little or no net CO2 emissions. Road transport Could rise to 3 Gt carbon by 2050 with over 2 billion vehicles. Improved efficiency or a hydrogen economy could each reduce this by 1 Gt. Doing things differently Imagine what can be achieved with the internet and wireless technology! Nuclear energy 700 1 GW plants rather than 700 conventional coal fired plants means 1 Gt less carbon emissions per annum. Options for change – enabling technologies Emission reduction Energy conservation and efficiency
Principal references and sources • BP 2003: Statistical review of world energy • Central Intelligence Agency 2004: The world factbook • Evan Mills Ph.D., IAEEL and Lawrence Berkeley NationalLaboratory 2002: The $230-billion global lighting energy bill • Hadley Centre and Carbon Dioxide Information AnalysisCentre (CDIAC) • IEA 2003: CO2 emissions from fuel combustion 1971-2001 • IEA 2002: World Energy Outlook • IPCC 2001: Climate change 2001, Synthesis report • IPCC 2000: Emissions scenarios: A special report of workinggroup III of the Intergovernmental Panel on Climate Change • UN 2002: World population prospects • WBCSD 2004: Mobility 2030: Meeting the challenges toSustainability