Download
1 / 18
180 likes | 198 Vues
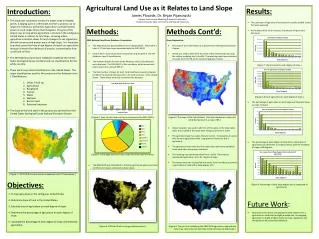
This study proposes a prediction approach using a dynamic generalized linear mixed model to estimate agricultural land uses. Predictor variables include agrometeorological and economic data, as well as information on last year's land uses. The model's performance is evaluated through simulation. The study also addresses the scale problem by using spatial data collection techniques and creating empirical spatiotemporal semivariograms. The proposed model-based approach allows for estimations of land uses in small areas.

E N D
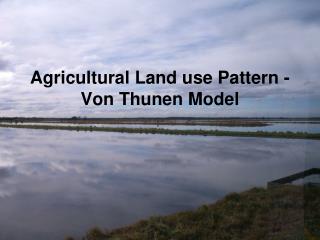
A PREDICTION APPROACH TO AGRICULTURAL LAND USE ESTIMATION Ambrosio L. , Marín C., Iglesias L., Montañés J., Rubio L.A. Universidad Politécnica Madrid. Spain Financial support from the Spanish Ministerio de Ciencia y Tecnología and from the Junta de Andalucía is gratefully acknowledged.
INTRODUCTION • Farmer land use decisions are modeled using adynamic generalized linear mixed model (multinomial) allowing for spatiotemporal correlation • Based on this model, a predictor of agricultural land uses is defined • The predictor variables are: (i) biological data provided by an agrometeorological model, (ii) economical data and (iii) data on last year land uses • In order to identify the correlation structure, a spatiotemporal variogram model is used • The predictor performance is evaluated by simulation
AREA SAMPLING FRAME FOR GROUND DATA COLLECTION • Currently, most of agricultural data are collected using spatial sampling (FAO 1996, 1998). • A spatial sampling scheme, made popular by the Joint Research Centre of the European Union, uses topographic maps as sampling frame and the 1 km by 1 km UTM square as sampling unit (usually this sampling unit is reduced to a 700 m by 700 m).
Sampling units are grouped into 10 km by 10 km blocks with 100 sampling units in each A systematic sample with three sampling units in the same positions within each block, is selected. Aerial photographs are used to collect data on land uses within sampling units Spatial location of the sampling units.
The ground data • In order to estimate the statistical model parameters, ground data are needed and the land use observed in the systematic sample conducted every year by the Spanish Ministry of Agriculture, Fishing and Food will be used as ground data.
PREDICTOR VARIABLES Statics Agrometeorological models output Economic variables Dynamics Last year land uses
CGMS Agrometeorological model CGMS was designed to produce quantitative yield forecasts of the crop yield of the main European crops. It will be used here to compute an index of crop suitability in each 10 km by 10 km block.
The CGMS output data Some of the model output are: • The weight biomass generated by the crop and the weight dry matter in storage organs (potential and water limited) • The total water consumption and requirement. This data can be computed for areas as small as a plot.
Economic variables • European Union direct aid per hectare, as defined in the Common Agricultural Policy.
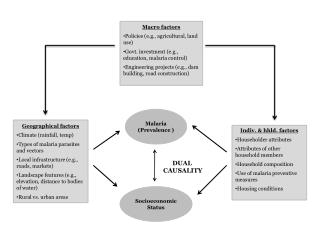
THE SCALE PROBLEM • The scale problem arises because biophysical (Land uses and CGMS output) and economic variables are observed at different spatial scales. • The advances in the techniques of spatial data collection (satellite images), the advances in geographical information systems (GIS) that allow us to put together data from different sources, and the use of internet as a data distribution channel, makes the scale problem and the overall problem of analysing data collected using different spatial scales a problem common to many sciences.
Empirical spatiotemporal semivariograms. In building this model it is necessary to create meaningful observational units and to transform all the data to the same spatial support This is the “change of support problem” which has two main effects: “overdispersion” and “spatial autocorrelation” The spatiotemporal variogram allows us to take account of these two problems and is used in order to specify the working correlation matrix . Modelling the scale problem
THE MODEL • The working model is • where is a row vector of explanatory variables of known values, is a column vector of unknown parameters, is the vector of land uses in last year, is a column vector of unknown parameters and is the correlation matrix defined by the spatiotemporal variogram.
Estimation Parameters are estimated by solving the following system by iteratively reweighted least squares Where:
THE PREDICTOR Based on the model a land use estimator is defined, which makes optimal use of the available data, according to statistical criteria. The predictor is where, with If beta, and V are known, then the predictor is unbiased and its error is minimum.
SMALL AREA ESTIMATION There is a growing demand for reliable estimates over small areas (counties). Due to the small sample size in small areas, the design-based approach does not provide sufficiently precise estimates for most uses. The proposed model- based approach provides estimations (predictions) of land uses in areas as small as 10Km by 10 Km.
Mapping predictions of crop areas of the main crops within 10Km by 10Km blocks in a Spanish zone. Predictions