Download
1 / 16
160 likes | 621 Vues
Comparison of the 1991 NIOSH lifting equation and erector spinae EMG . G. G. Weames, M.Sc. J.P. Stothart, Ph.D. and D. Gordon E. Robertson, Ph.D. Biomechanics Laboratory School of Human Kinetics, University of Ottawa, Ottawa, CANADA. Introduction. 1991 NIOSH Lifting Equation

E N D
Comparison of the 1991 NIOSH lifting equation and erector spinae EMG G. G. Weames, M.Sc. J.P. Stothart, Ph.D. and D. Gordon E. Robertson, Ph.D. Biomechanics Laboratory School of Human Kinetics, University of Ottawa, Ottawa, CANADA
Introduction • 1991 NIOSH Lifting Equation • Emperical method for identifying a weight limit for certain lifting tasks. • Used by occupational health practitioners to reduce the risk of lifting-related LBP. • Revised from the 1981 NIOSH lifting equation reflecting new findings and increasing its applicability: • asymmetrical lifts • container couplings • work durations • lifting frequencies
Comparison of Lifting Factors for the 1981 and 1991 NIOSH Equations. Lifting Factors 1981 Equation 1991 Equation Load constant 40 kg 23 kg Horizontal (HF) 15/H 25/H Vertical (VF) 1-.004[V-75] 1-.003[V-75] Distance (DF) 0.7+7.5/D 0.82+4.5/D Frequency (FF) 1-F/F from Table max Asymmetry (AF) not available 1-.0032A Coupling (CF) not available from Table (Taken from Putz-Anderson and Waters, 1991) Introduction
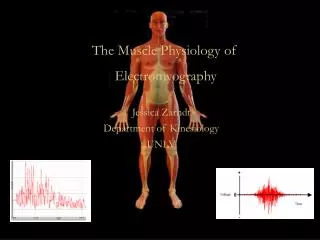
Study Rationale • Increased workload is an important factor in the cause of LBP (Chaffin and Anderson, 1991). • There is a general concensus that occupational lifting is an activity that uses trunk muscle tissues to generate the lifting effort (Seroussi and Pope, 1987; Marras and Mirka, 1988, 1989, 1990; McGill, 1991, 1991; Kumar and Garand, 1992; Lavender et al., 1992; Sommerich and Marras, 1992). • To date, there are no studies that quantify the safe level of trunk muscle activation during standardized dynamic lifting tasks. • There is a need for validation procedures to test the 1991 NIOSH lifting equation (Putz-Andersson, 1991; Waters et al., 1993).
Purpose • The Purpose of this study was to determine if the 1991 NIOSH lifting equation was in agreement with muscular load limits of the m. erector spinae for symmetrical and asymmetrical lifting tasks. • It was also possible to evaluate the effectiveness of the 1991 NIOSH equation to adjust the load for different lifting senarios based on the response of the ES EMG activity.
Methodology • Electrode Placement • Maximum Voluntary Contraction • Lifting Conditions • Data Reduction
Methodology • Lifting apparatus
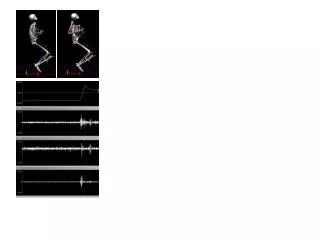
Y Z • Differential • Amplifier • 10-1000Hz • 80dB CMRR • 2000 gain X Force Platform 6 EMGs Vertical (Y) force Raw EMG • A/D Converted at 1050 Hz • Collected by BIOWARE (Kistler) • FWR • LPF (crit. damp.) • 4Hz cut-off • Normalized to %MVC • Lift cycle identified • BIOPROC (U of O) 386 Kinteak Methodology • Data collection
Methodology • Data reduction %MVC 100 0 % Lift 8 within subject condition trials • Ensemble Average • (Yang and Winter, 1984)
1 2 3 4 Methodology
% MVC Probability Level 2-5% MVC 0.1 10-14% MVC 0.5 50-70% MVC 0.9 Methodology Threshold Limit APDF Muscular Contraction Levels
Mean Condition Lift Durations. Condition 1 2 3 4 5 3.1 3.0 3.0 3.1 3.2 Mean (s) 0.4 0.3 0.3 0.3 0.3 Standard Dev. (s) Results
Condition %MVC Values that Exceed Muscular Load Limits for APDF Probabilities 0.1, 0.5 and 0.9 Electrode Condition 1 2 3 4 5 Right ES (T9) .1 .1 .1 - - Left ES(T9) .1 .1 .1 .1 .1 Right ES(L1) - - - - - Left ES(L1) - - - - - Right ES(L3) .1, .5 .1, .5 .1, .5 .5 - Left ES(L3) - .1 - - - Results
Conclusions • The m. erector spinae muscular load limits were in general agreement with NIOSH determined symmetrical and asymmetrical lifting tasks. • The m. erector spinae at level L3 produced the highest normalized %MVC levels for all lifting tasks. • APDF derived muscular load limits were significantly (p<0.01) more sensitive to the various lifting tasks used in this study than what the 1991 NIOSH equation could detect.