Download
1 / 1
10 likes | 167 Vues
price. supply. crop. animal. statistic. balance. production. production. sheets. statistic. statistic. foreign. horticulture. trade. Output Generation. Output Use. production. statistic. statistic. national /. Input Use. Input Generation. cost of. agricultural.

E N D
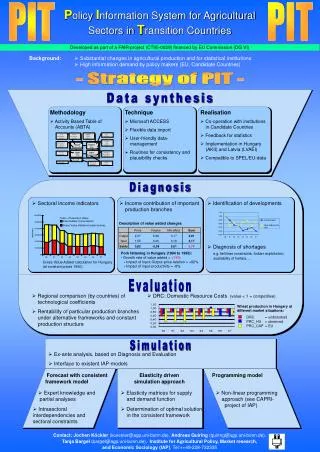
price supply crop animal statistic balance production production sheets statistic statistic foreign horticulture trade Output Generation Output Use production statistic statistic national / Input Use Input Generation cost of agricultural production accounts Level Level crop area fodder livestock balances numbers PIT PIT Policy Information System for Agricultural Sectors in Transition Countries Developed as part of a FAIR-project (CT95-0029) financed by EU Commission (DG VI) Background: Substantial changes in agricultural production and for statistical institutions High information demand by policy makers (EU, Candidate Countries) - Strategy of PIT - Data synthesis • Methodology • Activity Based Table of Accounts (ABTA) • Technique • Microsoft ACCESS • Flexible data import • User-friendly data- management • Routines for consistency and plausibility checks • Realisation • Co-operation with institutions in Candidate Countries • Feedback for statistics • Implementation in Hungary (AKII) and Latvia (LVAEI) • Compatible to SPEL/EU-data Diagnosis • Sectoral income indicators • Income contribution of important production branches • Identification of developments • Diagnosis of shortagese.g. fertiliser constraints, fodder exploitation, availability of heifers, ... Description of value added changes Pork fattening in Hungary (1994 to 1995): - Growth rate of value added = +74% - Impact of Input-Output-price-relation = +82%- Impact of input-productivity = -8% Gross Value Added calculation for Hungary (at constant prices 1990) Evaluation • Regional comparison (by countries) of technological coefficients • Rentability of particular production branches under alternative frameworks and constant production structure • DRC: Domestic Resource Costs (value < 1 = competitive) Wheat production in Hungary at different market situations: DRC = undisturbed PRC_HU = observed PRC_CAP = EU Simulation • Ex-ante analysis, based on Diagnosis and Evaluation • Interface to existent IAP-models Forecast with consistent framework model Elasticity driven simulation approach Programming model • Expert knowledge and partial analyses • Elasticity matrices for supply and demand function • Non-linear programming approach (see CAPRI- project of IAP) • Intrasectoral interdependencies and sectoral constraints • Determination of optimal solution in the consistent framework Contact: Jochen Köckler (koeckler@agp.uni-bonn.de), Andreas Quiring (quiring@agp.uni-bonn.de), Tanja Bargel (bargel@agp.uni-bonn.de), Institute for Agricultural Policy, Market research, and Economic Sociology (IAP), Tel:++49-228-732335