Analysis of PABP Expression in Cancer Cell Signaling Pathways
10 likes | 113 Vues
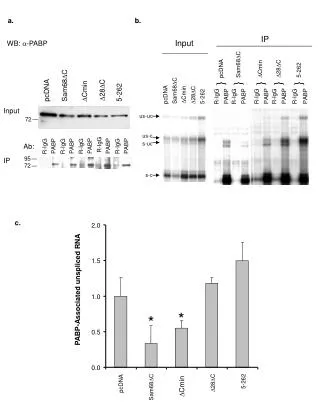
Study on mRNA populations in cancer cells expressing PABP using microarrays, analyzing protein interactions & cell lysis with Flag-G10 PABP retroviruses.

Analysis of PABP Expression in Cancer Cell Signaling Pathways
E N D
Presentation Transcript
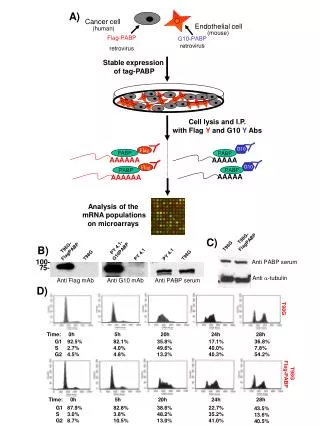
100- 75- A) Cancer cell Endothelial cell (human) (mouse) Flag-PABP retrovirus G10-PABP retrovirus Stable expression of tag-PABP Cell lysis and I.P. with Flag Y and G10 YAbs Y Y G10 Flag PABP PABP Y Y AAAAAA AAAAA G10 Flag PABP PABP AAAAA AAAAAA Analysis of the mRNA populations on microarrays T98G- FlagPABP C) T98G T98G- FlagPABP PY 4.1- G10PABP B) PY 4.1 PY 4.1 T98G T98G Anti PABP serum Anti a-tubulin Anti Flag mAb Anti G10 mAb Anti PABP serum D) T98G Time: 0h 5h 20h 24h 28h G1 S G2 92.5% 2.7% 4.5% 82.1% 4.0% 4.8% 35.8% 49.6% 13.2% 17.1% 40.0% 40.3% 36.8% 7.8% 54.2% T98G Flag-PABP Time: 0h 5h 20h 24h 28h G1 S G2 87.9% 3.0% 8.7% 82.8% 3.8% 10.5% 38.6% 48.2% 13.0% 22.7% 35.2% 41.0% 43.5% 13.6% 40.5%