Climate Variability and Drivers Impacting Agriculture in Central Victoria (2011)
260 likes | 379 Vues
This report examines the climatic drivers affecting agricultural practices in Central Victoria, highlighting significant patterns and anomalies observed between 2006 and 2011. Key trends include the effects of El Niño and La Niña phenomena, variations in annual rainfall patterns, and the influence of the Southern Annular Mode (SAM). Historical data, moving averages, and the role of sub-tropical ridges are discussed, demonstrating the complex interplay of climatic factors. The findings offer insights crucial for agronomists and farmers in adapting to environmental changes.

Climate Variability and Drivers Impacting Agriculture in Central Victoria (2011)
E N D
Presentation Transcript
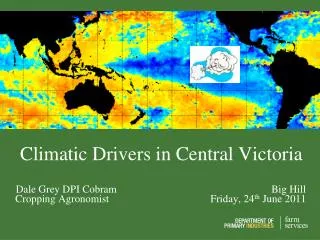
Climatic Drivers in Central Victoria Dale Grey DPI Cobram Big Hill Cropping Agronomist Friday, 24th June 2011
Annual Rainfall Absurd level of variability
Federation WWII Annual- 5 year moving average
Summer Autumn Spring Winter
Autumn rainfall 5 year moving average Macedon Harrietville Lake Wartook Warburton Ballarat Woods Point
November 2006 El Niño Cold off Darwin-Qld El Niño surface temperature anomaly
December 31st 2007 La Niña Warm off Darwin-Qld Classic horseshoe shape of warm water for La Niña
August 2006 Cool Broome-Brisbane x x IOD+ Strong in 2006, weak IOD+ in 2007 and strong again in 2008, the triple whammy.
October 21st 2010 x Warm Broome-Brisbane x IOD- Only a weak one this year. Started in late Sept, through October, gone in November. Probably wont be recognised as an official IOD- year
El niño 23 years 24 years 1877-2010 18 years La niña 29 years
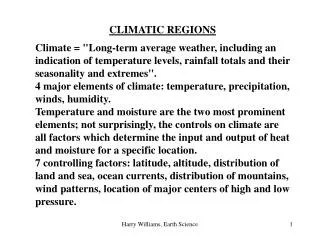
The SAM index is calculated by the differences in pressure between 40o and 65o degrees latitude Most of the upward trend is over Summer and Autumn Southern Annular Mode, SAM or AAO Measures the strength of polar westerlies in the Southern Ocean.
Source = NOAA 2010 the winter SAM was strongly Positive. Developing La Nina trumped this in Victoria and we got average rainfall, speak to someone in WA and Sth Africa about it though.
Source = NOAA 2009 the winter SAM was strongly Negative. The developing uncoupled El Nino failed to trump this in Victoria.
11 years +SAM 1957-2009 13 years -SAM
Sub-tropical ridge The Sub tropical ridges originate as a result of the Hadley Cells emanating from the Equator. One in each hemisphere, dry, descending air, causing high pressure. Mediterranean climates and deserts occur in these regions of the world.
July 2009 Winter pattern, strong highs centered over the top of the Bight Jan 2009 Sub Tropical Ridge The High pressure belt lying over Australia and at all mid latitudes of the world. Summer pattern, centre of highs over Melbourne
30 years 27 years 1890-2009 28 years 27 years
Winter Pacific Ocean- Mixed Indian Ocean- Neutral (weak IOD+) Winter Rainfall- Average Winter Temperature- Average/slightly warmer
Spring Pacific Ocean- Mixed Indian Ocean- Neutral (weak IOD+) Spring Rainfall- Mixed Spring Temperature- Average
That’s all Folks Nias Island, west Sumatra Diani Beach, southern Kenya See me to Subscribe to “The Break” eNEWSLETTER