Download
1 / 19
190 likes | 356 Vues
South Carolina AERMOD Meteorological Data Processing: Selected Highlights of 2002-06 Update John Glass SC BAQ. Why update from ’87-91 to ’02-06 ?. ► “Consecutive years from the most recent, readily available 5-year period are preferred.” (EPA 40 CFR, Part 51, Appdx W)

E N D
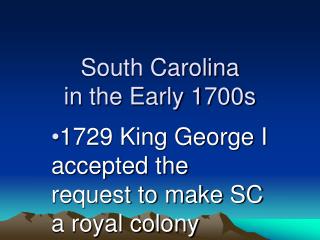
South CarolinaAERMOD Meteorological Data Processing:Selected Highlights of2002-06 UpdateJohn GlassSC BAQ
Why update from ’87-91 to ’02-06 ? ►“Consecutive years from the most recent, readily available 5-year period are preferred.” (EPA 40 CFR, Part 51, Appdx W) ►Improve station representativeness by increasing no. of stations (# of sfc met. stations w/ 5-yrs of data has increased due to ASOS implementation) ►Incorporate “new” AERSURFACE (Jan ’08)
Overview AERSURFACE Surface Obs AERMET Upper Air Soundings Station Representativeness Analysis SC Met Data Zones AERMOD-Ready Data sets
“Raw” Meteorological Data • Surface Observations ● ISHD (NCDC download: htp://ftp.ncdc.noaa.gov/pub/data/noaa) ●16 stations (SC-12, NC-2, GA-2) ► Upper Air Soundings ● ESRL/NOAA database: http://raob.fsl.noaa.gov/
AERSURFACE ►Thoroughly researched anemometer Lat/Lon ● Coords per NCDC / NWS can be imprecise and/or inaccurate (as suggested in AERSFC User’s Guide) ● General Location (and any special info) – per verbal contact with NWS offices ► Example: anemometers are generally co-located with other ASOS instruments, but GSP anemometer is separated ~0.6 mi (~1 km) from other ASOS instruments [1 km = radius of surface roughness evaluation !]. ● Aerial Photos / GIS for accurate locn (6 decimal digits) .
AERMET REPAIRED missing data to increase no. of useable stations • Missing Data per AERMET Stage1 QA Report SURFACE DATA |------VIOLATION SUMMARY------| TOTAL # LOWER UPPER % # OBS MISSING BOUND BOUND ACCEPTED TMPD 8487 58 0 4 99.27 WDIR 8487 1187 0 0 86.01 WSPD 8487 203 0 0 97.61 • Per EPA Memo (“Procedures for Substituting Values for Missing NWS Meteorological Data for Use in Regulatory Air Quality Models”, Dennis Atkinson and Russell F. Lee, 7/07/92): ● Data sets <90% complete should not be used for air quality modeling purposes ● Objective and Subjective procedures for missing data substitutions
AERMET (cont’d) • 6 of 16 sfc stations had WDIR<90% complete for ≥1 year of data (23 sta-yrs total) • 3 stations were “repaired” to ≥90% using Objective & Subjective procedures ●Objective [for single missing hour, substitute with vector avg WDIR from 4 surrounding obs]: - employed first, before Subjective - used FORTRAN program [ EFFICIENT !] - accounted for majority of successful “repairs” ● Subjective [for consecutive missing hours, substitute a representative WDIR based on review of 5 or so obs before and after the void, if feasible]: - used only if still <90% after Objective - manual, time-consuming - contributed toward 1 successful sta-yr “repair” ► 3 stations (≥ 1 year) could not be “repaired” and were omitted from final slate
AERMET (cont’d) • Stations “Repaired” to ≥90% complete Improved to 90% w/ Subjective substitution
Final Slate - 12 Met. Stations Omitted due to missing data Omitted due to anemom. height discrepancy
Representativeness Analysis • GOAL: To divide the state into 12 areas (along county lines, if feasible), so that the meteorological station/data assigned to a given area is the most representative for AERMOD modeling purposes for all facilities within that area. • Loosely followed Iowa DNR “Representivity Analysis” http://www.iowadnr.gov/air/prof/tech/files/representivity_analysis.pdf
Representativeness (cont’d) ► What is “Representative” data ? EPA 40 CFR, Part 51, Appdx W, Section 8.3 “The meteorological data used as input to a dispersion model should be selected on the basis of spatial and climatological (temporal) representativeness as well as the ability of the individual parameters selected to characterize the transport and dispersion conditions in the area of concern.” ►Factors considered: - Proximity - Climatology - Terrain - Land Use - Facility Locations
Proximity – Thiessen Polygon Analysis- Primary basis for dividing state - Refine areas using other factors
Climatology - Mostly covered by proximity (Thiessen) analysis - Wind Roses (wind spd/dir most critical for dispersion modeling) - Overall impact was minimal (roses similar at adjacent stations) - Local effects in CLT rose led to limiting size of CLT area GSP CLT CAE GRD
Terrain● Example impact: led in part to decision to split Laurens Co. between GSP and GRD 948’ 630’
Land Use (NLCD 2001)● Main utility: ensure consistency (broad-scale) in land use within each final met. area
Facility Locations● Example impact -- led to decision to include Kershaw Co. in CAE (vs. FLO) area FLO CAE
1987-91 vs. 2002-06 1987-91 7 Stations 2002-06 12 Stations
COMMENTS ?? • QUESTIONS ?? John Glass, 803-898-4074, glassjp@dhec.sc.gov