Unlocking Landscape Monitoring Potential with Barcode Resources
610 likes | 727 Vues
Discover the innovative use of DNA barcoding for landscape monitoring, food web reconstruction, GM crops, and pollen dispersal tracking by leading researchers. Explore the effectiveness and future applications of in situ barcoding and remote monitoring.

Unlocking Landscape Monitoring Potential with Barcode Resources
E N D
Presentation Transcript
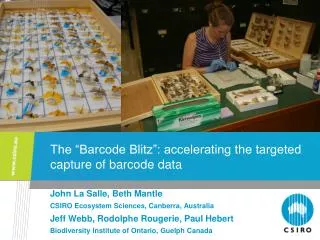
Thinking beyond the barcode: How best to exploit the emerging barcode resources? Dr Sandra Ronca2 Dr Caroline Ford1 Dr Amanda Clare2 Chinyere Nzeduru2 Dr A. OrtezArnaiz3 Prof Mike Young2 Dr Joel Allainguillaume2 Mike Wilkinson1 School of Agriculture, Food & Wine (1) The University of Adelaide, Adelaide, Australia(2) Aberystwyth University, United Kingdom(3) INE-SEMARNAT, Mexico City, Mexico
Overview • Background: the global need for effective landscape monitoring • Case studies on the use of DNA barcoding • Food web reconstruction • Identifying Non-targets for GM Bt crops • Tracking Pollen dispersal • Looking ahead • Field sampling and the potential for in situ barcoding • The potential for remote monitoring of the landscape
Temperature Change Data 1880-1884
Temperature Change Data 1880-1884 1986-1990 2003-2007 1946-1950 1966-1970 1976-1980 1996-2000 1926-1930 1956-1960 1906-1910 1916-1920 1886-1890 1896-1900
Temperature Change Data 2003-2007
World Population Growth Billions 12 11 2100 10 9 Modern Age Old 8 Iron Middle Bronze Stone Age New Stone Age Ages Age Age 7 Future 6 2000 Future 5 4 1975 3 1950 2 1900 1 1800 Black Death — The Plague 2000 1+ million 7000 6000 5000 3000 1000 A.D. 4000 A.D. A.D. A.D. A.D. A.D. years B.C. B.C. B.C. B.C. B.C. B.C. B.C. 1 1000 2000 3000 4000 5000 Source: Population Reference Bureau; and United Nations, World Population Projections to 2100 (1998).
Potential for land-use conflict Agriculture Biodiversity Biodiversity hotspots www.biodiversityhotspots.org People
The state of play • The global landscape is in a state of rapid flux • There is huge potential for conflict between competing sectors over land use The need is for • New systems to allow more effective detection of change at the landscape scale Is there a role for DNA barcoding?
Case 1: Foodweb reconstruction parasitoids pathogens predators aphids aphids aphids Such studies are essential pre-requisites for mechanistic modelling of foodweb resilience van Veen et al. (2008) J. Anim. Ecol.
One trophic level: in vitro experiments Simple direct Sanger sequencing of: Myzuspersicaeaphids feeding on B. napus and B. oleracea Plutellaxylostellafaeces from individuals feeding on B. napus rbcL-matched food COI- matched herbivore
Wild-collected material • Herbivores • Matched expected COI (except 1 infested Pieris larva which matched Hymenoptera sp.) • rbcL mostly matched Pinus, including aphids (samples collected under pine trees) • Predators • COI from faeces mostly matched the predator or yielded ambiguous sequences • Pine predominated the rbcL sequences
Used Mitochondrial DNA from droppings to identify Moas Wood et al (2008) Quaternary Science Reviews 27 2593–2602
Ancient samples Alan Cooper, (Australian Centre for Ancient DNA, University of Adelaide) Now refining diet with plant minibarcode 454 analyses with minibarcodes
Case 2: Identify Non-Target Organisms for GM crop Risk Assessment
Cry Protein Toxin • T his delta endotoxin has three domains • Domain I and II are very conserved. • Domain III is highly variable & attaches to different receptors. • Common variants used in agriculture are: • Cry1Ab, Cry1Ac, Cry1F, Cry2Ab (Lepidoptera) • Cry3Bb (Coleoptera)
What is the main environmental concern? That the transgene product will also harm non-target, beneficial, culturally-important or rare insects
The problem Identifying insects at risk in the receiving country This can be non-trivial; even when the fauna is species-poor and well-characterised
The UK Farm-Scale Evaluations • Five year study costing 9.1M US$ in 1999 • the most comprehensive field study of invertebrate biodiversity in GM crops • Heavy investment to ensure adequate capacity for invertebrate identification • Nevertheless, for most major groups collected, specimens were only identified to family or higher ranks, despite the comparative paucity of the fauna D.B. Roy, et al., Philos. T. R. Soc. B358, 1879-1898. J. Archer, B. Jamieson, N. Wingfield. Defra report. Webarchive.nationalarchives.gov.uk (2004).
Coelioxys spp. Hymenoptera Apis mellifera spp. Xylocopa spp. Vespidae spp. Coleoptera Diptera Lepidoptera
Lepidoptera: Cry1 and Cry2 susceptible Eurema spp. Protaetia spp. Amata spp. Mylabris spp. Pelopidas spp. Coleoptera: Cry3 Chloreuptychia spp. Junonia spp.
The value of barcoding • Cost & speed savings • Completed by one MSc student in 3 months • Cost <10,000 US$ • Resolution • Key NTOs identified to genus even without CBOL database • Standardisation • Voucher allows for post-hoc correction • Ensures equivalence of identification • Resolution will improve with time
Case 3: Characterising insect-mediated pollen delivery from GM Rapeseed to wild relatives Brassica napus Brassica rapa
How much rapeseed pollen does each pollinator carry? Count? or can barcoding help?
qPCR amplification of rbcL from pollen dilution series So qPCR can be calibrated to crudely estimate total pollen number on an individual 20000 2000 200 10 pollen grains 10000 1000 20 pollen grains
B. napus B. napus What proportion of that pollen is crop pollen? • Pyrosequencing • Can quantify to a level ≤ 10% presence of a species in a mix DNA CALIBRATION CURVE POLLEN CALIBRATION CURVE
Collection sites Culham Tewkesbury Appleford
Apismellifera Percent crop pollen Ringhiacampestris Distance (m) Percent crop pollen Helophilus trivittatus Distance (m) Percent crop pollen Distance (m)
General findings • Insect-mediated pollen dispersal varied strongly between pollinators • Honey bees, whilst numerous, are least prone to carry pollen to B. rapaover long distances • Pollinator guild species composition varies with site and time So... • Predictive understanding requires knowledge of population dynamics, time and carriage profiles of all guild members
Characterising guild-wide pollen carriage behaviour in more complex settings
The challenge: • Indentify the pollinators • Characterise the pollen carriage by each member species over a time and spatial series
First: BARCODE POLLINATORS Bombus species visiting Rhos pasture - cox1 identification Bombushortorum Bombuscrypticus Bombusmagnus Bombuspascorum Bombus terrestris Bombus lapidarius Bombuspratorum Bombus soroeensis Neighbour Joining tree using K2P and the software MEGA4 to characterise the 278 (plus 15 references sequences from NCBI) bumble bees collected in the three Rhos pasture sites
B. terrestrisGlan yr Helyg Mid June Mid July Early August Late August
Trends observed • Pollen carriage profiles are highly site- and time-dependent • Species and gender significantly influence carriage but are less important • Medium-range foraging appears to be triggered by periods of low floral abundance
Looking ahead What is the scope for field-based barcoding? Can barcoding help reconstruct the landscape?
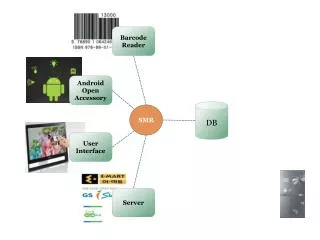
What are the steps needed for field barcoding? DNA extraction Amplification of target locus/loci Sequencing
For amplification • The problem is the fine temperature control needed for thermo-cycling during PCR The solution? Isothermic PCR
SensiMix PCR IsoAmp® II Universal tHDA Kit PCR HRM IsoAmp HRM
Real time Pyrosequencing Rbcl Pyrosequencing Assay
A. thaliana B. oleracea Result: TCAACCCGGA GTTCCACCTGAAG Quality: Passed (Quality window: 20) Result: TCAACCTGGAGTTCCACCTGAAG Quality: Passed (Quality window: 20) L. perenne A. capillaris Result: TCAACCTGGGGTTCCGCCGGAAG Quality: Passed (Quality window: 20) Result: TCAGCCTGGGGTTCCGCCGGAAG Quality: Passed (Quality window: 20)
These results gained in 50 minutes But what about field-based systems?
Landscape reconstruction (remote sensing) Elliott et al. 2004 J. Appl. Ecol. 41 1174-1184 Lui et al (20100WETLANDS Volume: 30 Issue: 5 Pages: 879-888
But still the resolution remains at community level rather than species/genus • The need is for a supplementary source of species-specific information
Wind pollination: Effect of population size and density Timmons et al 1995 EUPHYTICA Volume: 85 Issue: 1-3 Pages: 417-423 Published: 1995